
A blog reader and neighbor asked about rain in the ‘hood. As I have a rain gauge and too much time on my hands, here you are, Mark:
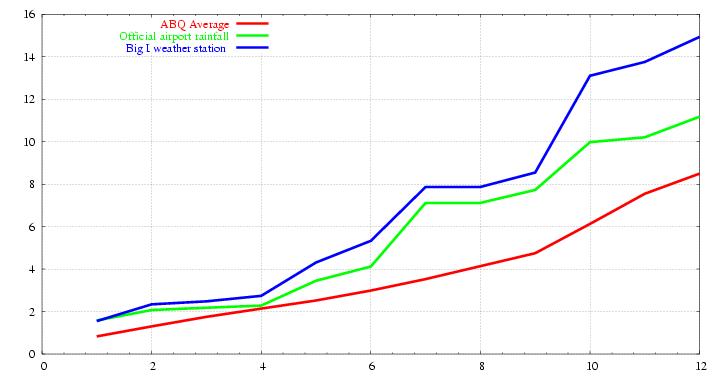
That’s cumulative rain for the 2003-04 “rain year,” which starts Oct. 1. (They do it that way so the whole winter precip season is captured in a single year’s statistic.) The red line is the long-term average at the official Albuquerque weather station. Green is the rain/snow at the official gauge this year, which is about three miles from my house. Blue is my rainfall.
By any measure, it’s been an extraordinarily wet year. I’ve only got five years of data at my house, but the official ABQ gauge is at a very similar point on the city’s elevational gradient, so there’s no reason to think my numbers ought to be a whole lot different. Most of the difference was a monster July (the tenth month on the graph), when I had a couple of huge thunderstorms that hit my house but largely missed the airport. The 4.5 inches I got in July is by far the wettest month since I put the rain gauge up. These can be hit-or-miss affairs. But in general, looking at the long-term statistics this afternoon, I found that I’m often reading higher than the official ABQ number. A bit of a puzzle.