
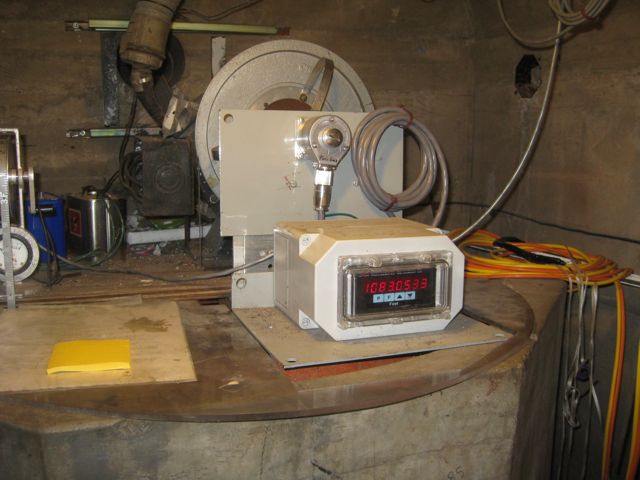
Hoover Dam stilling well, Oct 18, 2010
Four years ago, I stood on Hoover Dam staring down at the receding water line as Lake Mead set what was, at the time, a record low:
If you blow this picture up enough, you can probably see pixels of rock that have not been exposed since the 1930s. Or maybe not.
The surface elevation of Lake Mead hit 1083.18 feet above sea level today between 11 a.m. and noon Pacific time today, when this picture was taken. That is below the previous low – 1083.19 – on April 26, 1956. We can now unequivocally say that the drought of the ’00s and continued water consumption by downstream users has lowered the mighty reservoir to the lowest level it has seen since it was filled in the 1930s.
We’re about to do this again. In April, the surface elevation of Lake Mead dropped below the level for April 2010, and with each successive day, we set a new record for this point in the water year. By some time next month, Mead is forecast to drop below the 2010 record of 1081.85, set Nov. 27, 2010. I like to make graphs to help me visualize data:
With current estimated inflows and water use downstream, Lake Mead will end 2014 three feet below the 2010 record, and just eight feet below above the magic level of 1075 at which the first shortage declaration will be declared.
Pingback: Blog round-up: Mega-droughts, water surcharges, weakening enviro protections and lessons learned from the drought, plus the BDCP, water bond, groundwater and more … » MAVEN'S NOTEBOOK | MAVEN'S NOTEBOOK
Any idea why projection for 2014 shows no change between July and November but in 2010 the reservoir level dropped 10 feet over those months?
Eric – Great question, and after going back and looking at the data, my answer will not be entirely satisfactory. Half the difference comes from the September and October releases from Lake Powell, upstream, into Lake Mead. They were releasing less water in those months during 2010 than they’re projected to release this year during the same months. That explains about half the difference.
In addition, the projected releases during those months this year are larger than they were in 2010. They aggregate data suggests downstream users are calling for less water this year during the comparable months. But all this really begs the question of *why* those two operational variables are different this year. I’ll see if I can find out.
I think most of Colorado got “average” or even “above average” precipitation last winter, so maybe the upper basin is able to send more down from Lake Powell, but it seems hard to believe that California is calling for less water during its extreme drought this year. I understand from your other excellent plots that a large part goes to the Imperial Valley Irrigation District, but I still see lots of trucks carrying hay north from there to the Central Valley so I don’t think they are cutting back on their water usage.
Eric –
I used to have an editor years ago who would watch me do what I’m about to do and say, “Danger, journalist doing math!” Which is to say, until I have a chance to talk to the hydrologists running the system, be appropriately cautioned, but….
Taking Lake Mead monthly elevations (here: http://www.usbr.gov/lc/region/g4000/hourly/mead-elv.html ) back to 1980, it looks like 2014 is the more normal year, with inflow and outflow roughly in balance during the late summer and fall, although this is highly variable data. But appears that it is the big drops in 2010, rather than the relatively flat 2014, that need explaining.
Yes, it looks like 2010 was anomalous for the summer-fall levels. Maybe that was an exceptionally dry year in the upper basin so there was little snow melt to release from Lake Mead.
Thanks for all the work you put into this very interesting blog!
Pingback: A Halloween treat: Lake Mead’s not quite as empty as we expected | jfleck at inkstain
Pingback: Bloggers on drought, water bond ‘czars’, the Reber plan for SF Bay, designing dams for climate change, a water bond prediction, and more … » MAVEN'S NOTEBOOK | MAVEN'S NOTEBOOK