
Since I wrote last month about the impact (or lack of impact) of El Niño on Colorado River flows, Paul Miller at the Colorado Basin River Forecast Center has done a new, more detailed analysis than the one I showed (which I had attributed to the Central Arizona Project folks, but which originally came from CBRFC):
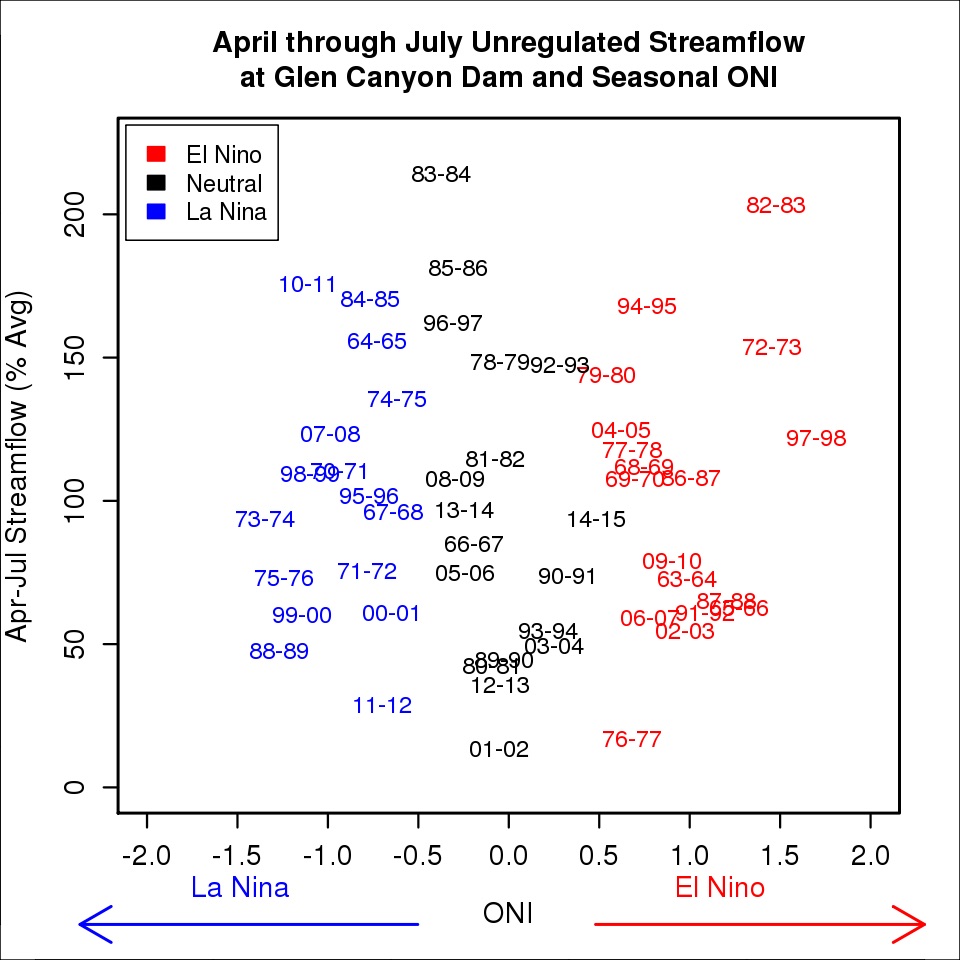
Courtesy CBRFC
The basic message is the same: the three strongest El Niño years have been wet, but that’s such a small statistical sample, and when you expand the universe to all El Niño years (the red ones on the graph above) you can see all kinds of scatter and pretty much zero statistical significance.
This is flow measured at Lee’s Ferry, the dividing line between the Upper Basin and the Lower Basin for purpose of Colorado River Compact administration. But Paul’s data got me curious. What about downstream of that point? Lee’s Ferry is the most important measurement point on the river, and the standard for this sort of thing. But flows below that point also are interesting, because the inflows downstream from Lee’s Ferry – especially the Virgin River and Little Colorado – are essentially “free water” for the Lower Basin when they are high and problem when they are low. And, in fact, El Niño years do show higher flows on this stretch of the river (warning: journalist doing his own math):
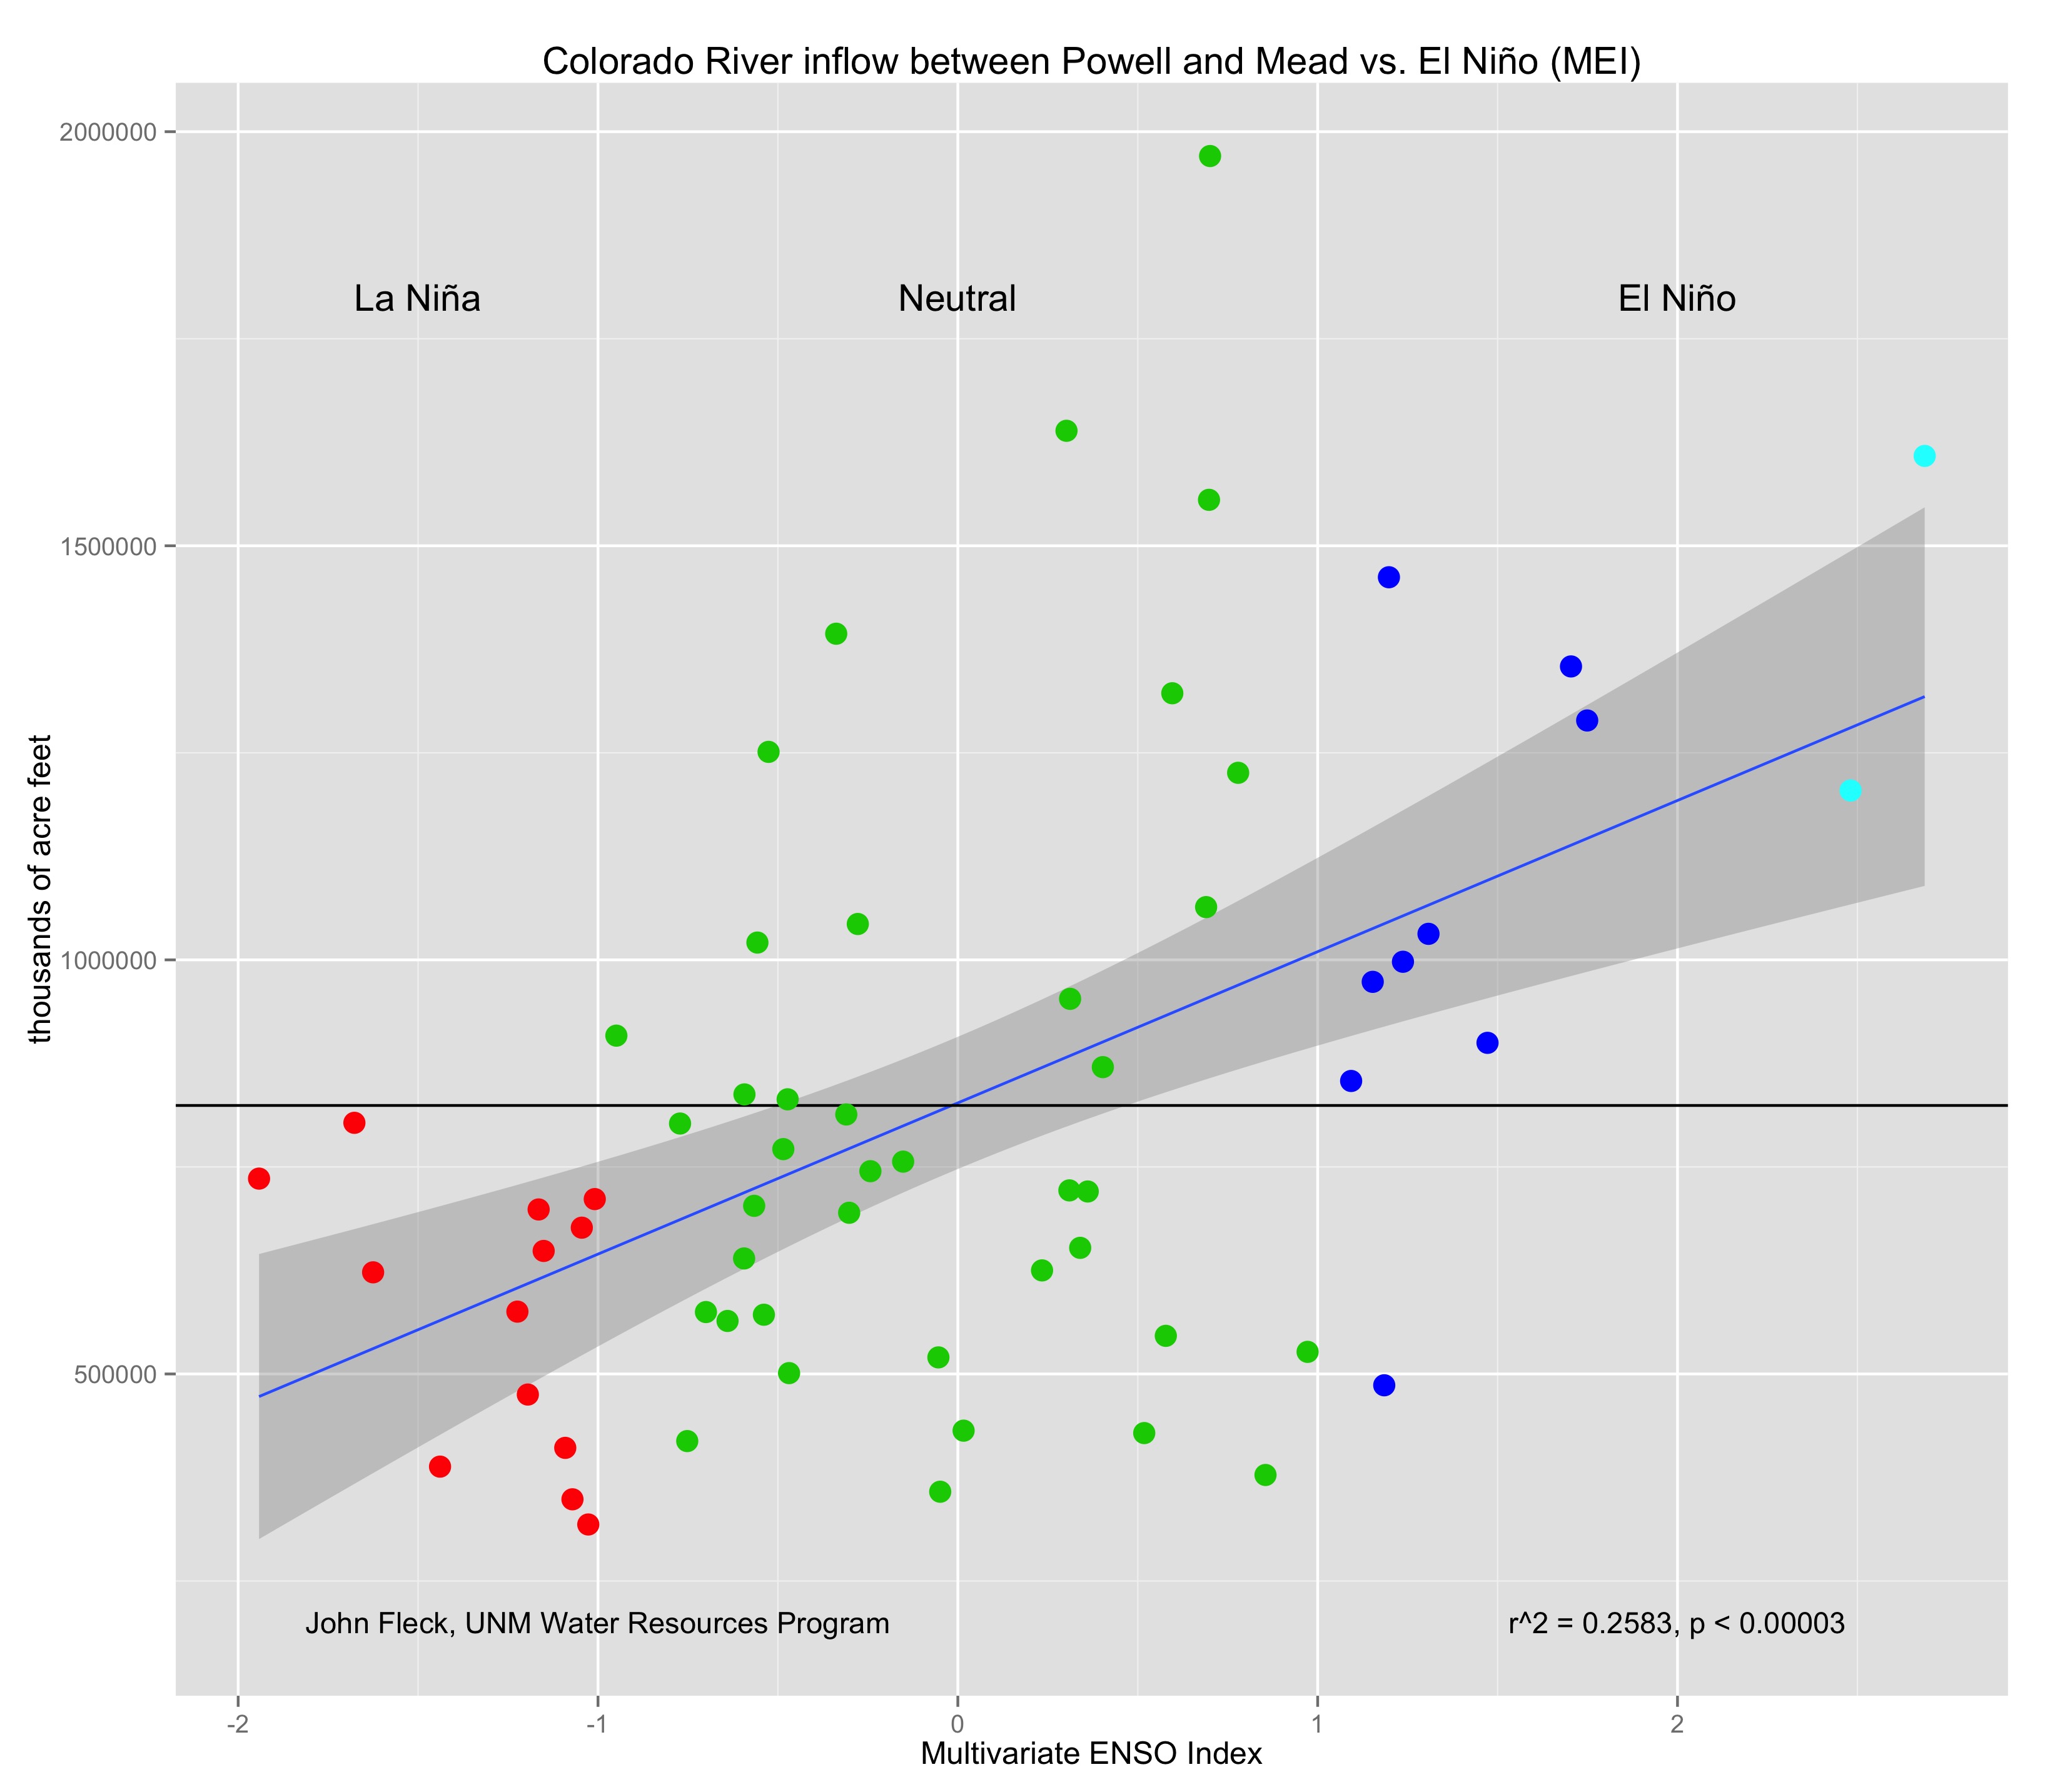
Impact of El Niño on Colorado River flow downstream of Lee’s Ferry
This makes sense. The impact of El Niño is weaker as you go north, into the main part of the basin. But in the lower basin, especially Arizona, El Niño does tend to be wetter to the tune of about 170,000 acre feet per year compared to the long term average for the period I looked at. I only calculated flows between Lee’s Ferry and Lake Mead, but river management folks say they also expect this downstream from Lake Mead, especially on the Bill Williams River. On average, this is enough to add a foot or two to Lake Mead during El Niño years. Not enough to make El Niño a drought mitigation tool, but a bit of potential good news for the Lower Basin.
(Note on data sources: El Niño comes from Klaus Wolter’s Multivariate ENSO Index, Colorado River flows from the USBR’s natural flow dataset. Period calculated: 1950-2012, because that’s the period for which the two datasets overlap.)
Pingback: La Niña watch - jfleck at inkstain