
Consumptive use of Colorado River water by the states of the Lower Basin (Nevada, California, and Arizona) is on track this year to be at its lowest since 1986. This graph, which I put together this weekend for a talk I’m giving at the Upper Colorado River Basin Water Forum at Colorado Mesa University in Grand Junction next week, seems pretty remarkable to me:
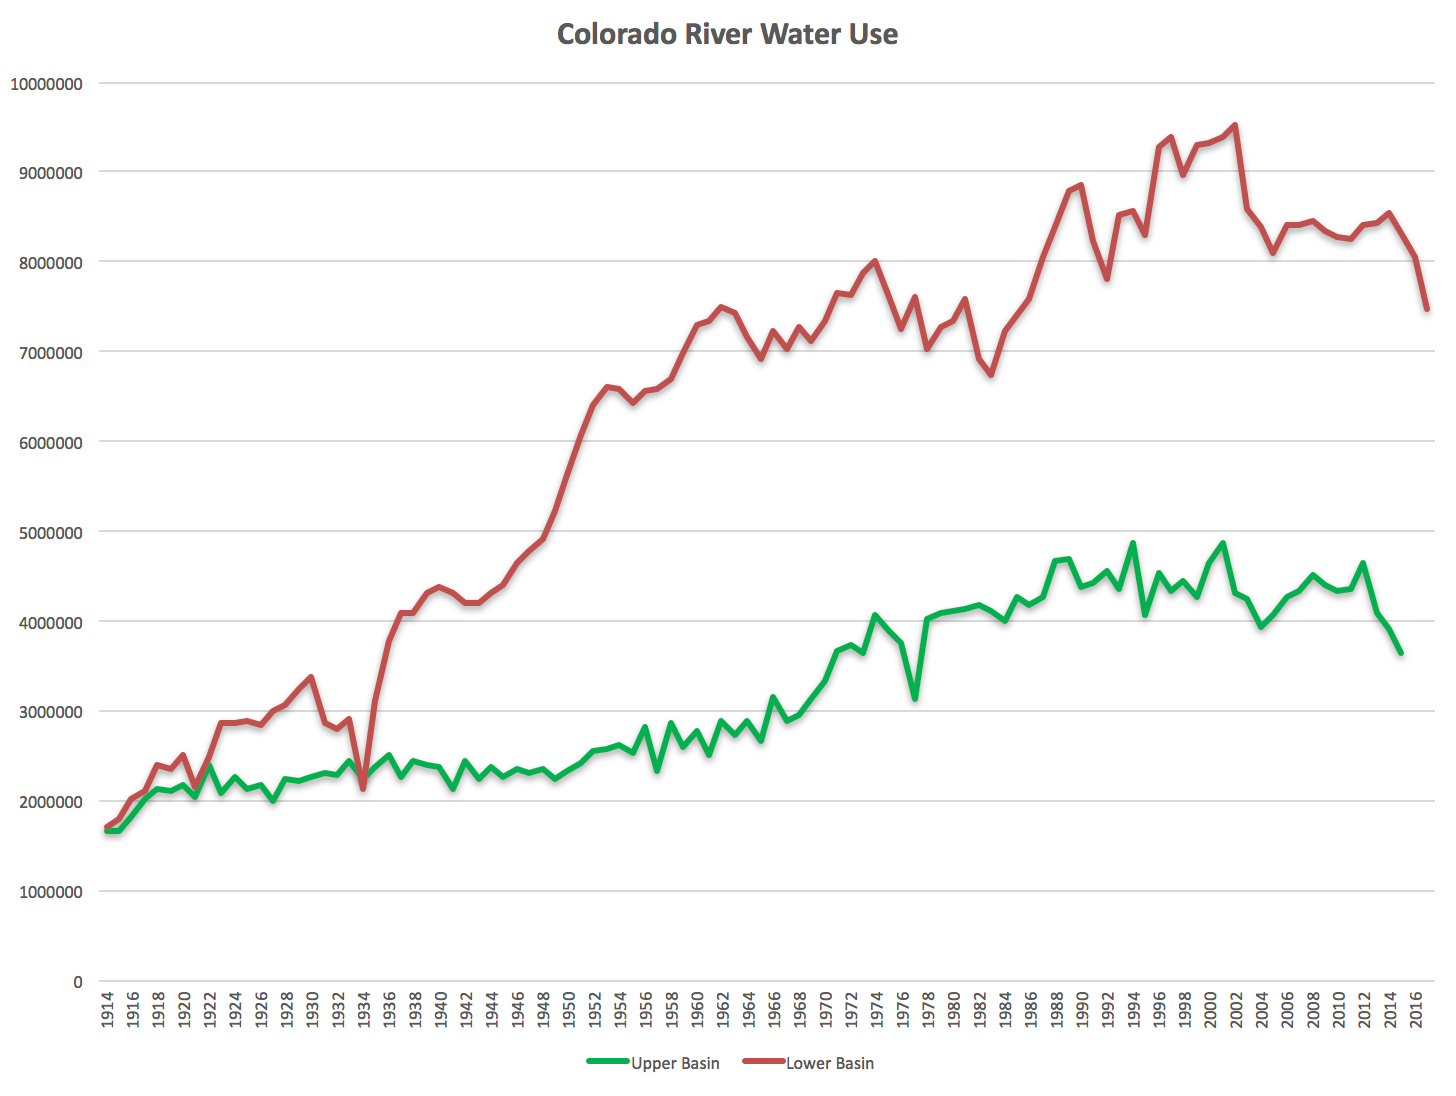
Colorado River water use, data courtesy USBR
That green Upper Basin line only goes out through 2015 (takes longer to get the UB data), but it’s telling a similar story – again, lowest since the 1980s. Upper Basin Colorado River water use peaked in the 4 million-and-change range in the 1980s and has stabilized.
My friend Scot looked at a version of this graph and immediately asked about population growth during this time, and it’s a good question, but I don’t have that graph yet so I just waved my arms and told him “It’s gone up a lot.”
We’re using less water because there’s less water to use (see science). But there’s been no apocalypse. People aren’t abandoning the region’s desert cities and moving to Cleveland. We’ve still got yummy Yuma lettuce on our winter burgers. We’re adjusting.
Notes on the data:
- Dataset provide by the US Bureau of Reclamation a couple of years ago, and updated by me with most recent data from their various routine reports. The most recent few data points on each curve are thus preliminary, subject to data updating and validation.
- As Eric Kuhn, who’s collaborating with me on this stuff, points out, the red Lower Basin line does not include use of tributary water in the Lower Basin, as for example the Gila in Arizona.
- The graphs include reservoir evaporation. That matters or doesn’t, depending on the question you’re trying to answer, but the shape of the curves, and the story they tell, is basically the same.
There’s some limit as to how little we can use and/or how many people can be supported. San Francisco residents are down to 41gpd, for instance, but few think that it can go lower. I guess someone could do the math and figure out: / 50gpd = the maximum population of the Southwest and/or California (different ‘water available’ numbers). Would that be a worthwhile exercise?
something got cut in the process:
/ 50 gpd = max. population supported.
I see. I can use pointy brackets. let’s try this: ‘water available for residential use’ / 50gpd.
I CAN’T use pointy brackets. Oh, to be able to edit a post!
Pingback: Blog: When people have less water, they use less water | H2minusO Blog