
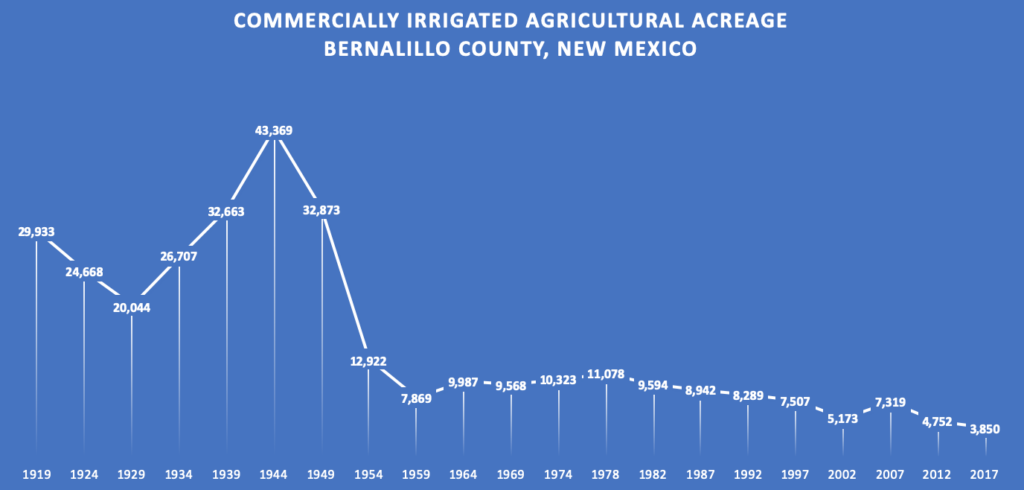
US Census, USDA Census of Agriculture
Holed up in a UNM Water Resources Program conference room, my book co-author Bob Berrens and I spent an afternoon last week trying to make sense of the graph above.
The 1920 U.S. Census description of the greater Albuquerque area (Bernalillo County) captures a remarkable moment in our city’s history. We were a community of ~30,000 people, surrounded by ~30,000 acres of farmland.
There were 10,205 acres of apple orchards, 6,482 acres of peaches. We grew pears, plums, cherries – each at over 1,000 acres. Farming spread up and down central New Mexico’s Rio Grande valley, but what the economists of the day described as “specialized farms” – fruits, vegetables, poultry, and dairy – were all clustered a quick farm truck’s drive (or wagon?) from the city.
Farther up and down the valley were found what those same economists of the day described as “general farms”, which we take to mean not marketing much directly in the city, basically either subsistence farming or failed/failing development schemes.
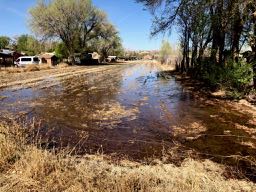
Bernalillo County irrigated agriculture, circa 2021
A series of economic studies from that time period, a rich lode of data we’re mining, suggest farms here didn’t do much in the way of export beyond the local markets.
There’s an early thinker (economist?) one quotes at this point in such discussions named Johann Heinrich von Thünen. In his 1826 book Isolated State, von Thünen basically argued that the land closest to a city would be the most valuable for producing the stuff people needed in the city, so there would be these rings radiating – fruit, vegetables, poultry, and dairy, for example:
Delicate horticultural products such as cauliflower, strawberries, lettuce, etc., would not survive long journeys by wagon. They can, moreover, be sold only in small quantities, while still quite fresh. All these products will be grown near the Town.
Gardens will therefore immediately occupy the land immediately around the Town.
Von Thünen was writing this before we could schlepp our food longer distances via rail etc., so the model needed a lot of adjustment (needed to be abandoned?) pretty soon after he developed it, but people like us still like to quote it because its simple formulation makes intuitive sense and helps us tell our stories.
So in explaining the graph above, von Thünen is a great starting point. And abandoning von Thünen quickly also has its utility. Here, we think, is the basic narrative structure:
1920
We live in a von Thünen world, with a growing city at its center and farmers clustered around, growing the food. There were 1,200 farms in Bernalillo County in 1920, according to the census.
1920 – 1930
Still a von Thünen world, but as the city grew, two other things were happening that drove down the acreage. First, the valley floor was becoming increasingly swampy as water tables rose because of the lack of drainage in the valley – super common problem in these irrigated places. Second, shipping technology, especially refrigeration, increasingly made imported foods attractive.
1930 – 1945
The creation of the Middle Rio Grande Conservancy District brought the long awaited panacea of drainage to the valley, lowering the water table and, combined with irrigation system “improvements” (much ink will be spilled in the new book to explain the scare quotes), a bunch more land was brought into production.
The available economic data suggests this did not go well for a large proportion of those who attempted it. Again, in the new book, much ink will be spilled.
But through the 1940s, they kept trying. By 1945 the number of farms had risen to 1,795.
1945 – 1960
With a booming post-war economy, the valley floor finally found its successful cash crop, as Bob likes to say – mortgages. As fast as the land could be turned over, farms became suburbs.
By 1960, the number of farms had declined to 495.
1960 – present
We think the graph above begins to lose its utility post-1960, because something else is happening that a simple tally of commercial agricultural irrigation doesn’t capture.
The total number of farms by the mid-1970s had dropped to 234. But then something strange happened which we need to explain. While the irrigated acreage remained flat to declining, the number of farms began to rise. By 2017, it was up to 1,248. Average “farm” size goes down and down and down, number of “farms” goes up. These are not farms in the classic connotation of the word – a piece of land used in a commercially agricultural way.
We are still using water down on the valley floor to, in a sense, irrigate those mortgages. Sometimes called “hobby farms”, perhaps more appropriately “custom and culture” farms, took hold.
Or just plain yards.
Where do you get your food from?