
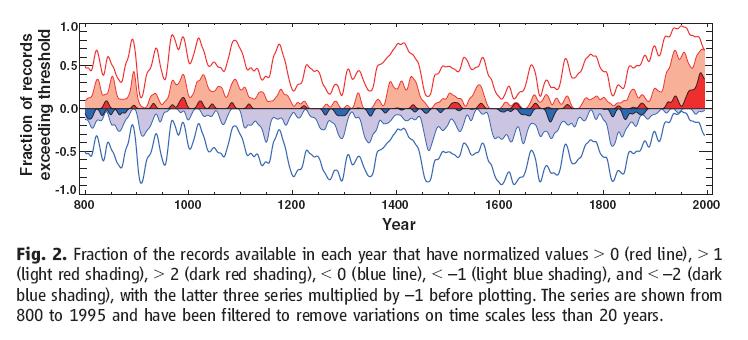
Timothy Osborn and Keith Briffa have a new paleoclimate reconstruction coming out in tomorrow’s Science with a familiar shape but an interesting new twist:
One of the difficulties in thinking about the various hockey stick-shaped paleoclimate reconstructions, (and by “difficulties” I do not mean the distracting food fights, entertaining as they may be update: let the food fight begin) is that the approach used boils them all down to a single number. That tells you something about overall averaged surface temperatures, but not about spatial extent.
Osborn and Briffa have attempted to rectify that with an index that looks at 14 separate proxy series spread across the northern hemisphere, to try to get a feel for how widespread warming was at various times. They create an index that sums up sites that are above or below normal in temperature relative to the long term mean. It’s an attempt to do with some rigor what Soon and Baliunas did in a qualitative fashion in a widely discussed paper three years ago.
Their conclusion:
The most significant and longest duration feature during the last 1200 years is the geographical extent of warmth in the middle to late 20th century. Positive anomalies during 890 to 1170 and negative anomalies during 1580 to 1850 are consistent with the concepts of a Medieval Warm Period and a Little Ice Age, but comparison with instrumental temperatures shows the spatial extent of recent warmth to be of greater significance than that during the medieval period.
(update 2: The paper is now up, and Mike Mann has useful discussion at RealClimate)
, but not about spatial extent.
Actually it’s says nothing at all about “overall averaged surface temperatures” or “spacial extent”. If the data is not valid, the methodology already shown to be faulty and wholly inappriopriate for the purpose it has been used for, and once again it uses data sources which cannot be checked or verified, then once again the merry-go-round of Hockey Stick promotion, Hockey Stick inclusion in the next IPCC report, Hockey Stick fake consensus, Hockey Stick hiding of statistical significance, Hockey Stick ranting about “fossil fuel lackeys” and “rightwing shills”, followed by slow retreat under a hail of “tobacco science” claims and other slander, “Hockey Stick” demotion to “the errors doesn’t matter” and “other studies confirm our plot” and “we will not be intimidated into revealing our data”
and once again it uses data sources which cannot be checked or verified
Yaaaaaaawnnnnnnnn.
It can be checked by those in the field. It’s too bad they don’t release their data to amateurs, nor to those who create character assassination web sites (or to the rhetoric framers who run character assassination wwws.).
But I do appreciate the rest of the argument; it’s like comfort food [comfort rhetoric?].
So this is the best you guys can do these days, John. I like it.
BTW, is there some energy lacking in the denialist movement somewhere? That is: how come you haven’t sent some bot forth and you have to do this yourself? Surely you still have rubes who can spread ‘Gaspe cedar yadayada’ or ‘R2 value for x year hoo-ha’ FUD here. Maybe Heritage can hold a bake sale to raise funds to entice some Googlers for you guys.
Best of luck,
D
Another enlightening post from Dano. Or not.
Anyway, I’m quite sure the dogmatists at the softball site Realclimate are jumping up and down about this, especially Mann and the other members of their self proclaimed “Hockey Team”. Without further ado, I’ll post Stephen McIntyre’s summary from the closer to neutral Climate Audit Site, which I think (do to his standing as a statistician)is relevent.
“Osborn and Briffa [2006], published today in Science, cannot be considered as an “independent” validation of Hockey Stick climate theories, because it simply re-cycles 14 proxies, some of them very questionable, which have been repeatedly used in other “Hockey Team” studies, including, remarkably, 2 separate uses of the controversial bristlecone/foxtail tree ring data. Also even more remarkably, they have perpetuated the use of Mann’s erroneous principal components method in one of their key proxies. Peer reviewers and editors at Science have failed to ensure compliance by Osborn and Briffa with journal data archiving policies, a frequent defect in paleoclimate reviewers for Science, as data for the study is not archived, nor is much of the source data. Of the source data which is archived, some is password protected, presumably for international security. Within the available record, many peculiar inconsistencies can be observed affecting both this study and Esper et al [2002], a study previously published in Science also with a non-existent data archive.”
I’m sure the answer is somewhere in between – but it certainly is *not* at Realclimate.
Now to wait for Dano to come in from his playground (or rather bring online with him) and listen to his ad hominem attacks.
I like the shrill tone, John A.
Love that link, Dano!
Steve H., lots of people use statistics in their jobs or even on an avocational basis, but that does not make them statisticians. That would involve either an appropriate degree, professional experience (as a statistician), and preferably both. Strain as you will, you can’t make Steve M. fit that standard. Now, consider that this lack of qualification in statistics is coupled with an utter lack of formal education or experience in climatology (the area to which the statistical skills are being applied), and one begins to wonder about Steve M.’s credibility when he attacks an entire academic discipline (paleoclimatology) along with the nation’s major professional scientific publication.
Steve B,
I was wondering what happened to you. You were talking about some statistics here but I couldn’t figure out exactly what statistics you were referring to. I’m glad you just pointed out your knowledge of the subject, so maybe you will answer my question over there. In the meantime, here’s another question about statistics for you. Maybe you can clue us all in on the answer to that? Like tell us which of those prestigious organizations are wrong, since they’re all using the same “data”.
Thanks, we really appreciate it.
Of course as an aspiring good Bayesian I would prefer to just glop them all together. Semi-joke aside, the issue here is very similar to the “hockey team” spaghetti graph. It’s not really a useful exercise to try to establish which one is correct. Rather, we want to look at the ensemble and see what the general trend is. In the end, once there’s a sufficient network of sensors in place to get an accurate reading on the oceans, I suspect that will be used as a check on the atmospheric readings. Until then, a general trend is really all we have. To answer your question, they’re all right.
Dano wrote:
And who are those in the field? The same restricted cabal who produced and promoted the first hockey stick!
By the way, Steve McIntyre has three peer reviewed articles published in GRL, is an IPCC AR4 reviewer and is arguably one of the most expert analysts of multiproxy studies in the world.
He’s certainly no amateur.
There is a reason why these people hide their data in password protected directories. It’s fear of discovery. Fear of proper statistical analysis. Fear that proper audit will show everyone that their “science” is a mirage.
Back to sleep, Dano.
Steve Bloom :
“…either an appropriate degree, professional experience (as a statistician), and preferably both. Strain as you will, you can’t make Steve M. fit that standard….”
So if Steve McIntyre has a maths degree, you would accept that he can be called a statistician, and that his arguments have mermit ?
Ahem. “…merit”
“we want to look at the ensemble and see what the general trend is”
Sounds to me like voting for reality, or claiming the “ensemble” of a series of model runs gives the “right answer.” Someone with your “background” in statistics might want to explain how the three are so far off, in terms of 95th percentile error bars. Next there’ll be error bars on model runs…
By the way, on the Hockey Team’s new regurgitation, how many of their secret recycled proxies are in the southern *half* of the world?
How about we try this. How about y’all (this means you, Dano, both Steves, John A) stop with the ad hominem attacks and actually discuss the issues.
It is easy, as I’ve argued elsewhere, to merely dismiss one’s opponents as being venal, or stupid, or both. That’s what everybody seems to be doing in this debate. That’s easy, but it’s a cheap refuge that allows you to ignore the substance being offered. By both sides.
To the hockey stick supporters: Steve McIntyre’s degrees are irrelevant at this point. He’s raised arguments that are interesting and substantive enough that at this point they’ve got to be dealt with on their merits, not dismissed by waving your hands at his resume. Steve hasn’t convinced me. The weight of the evidence seems to very much tilt against him. But there’s a reason I’ve included a link to ClimateAudit in my blogroll. You dismiss him at your peril.
To McIntyre’s supporters: The various paleoclimate reconstructions are what they are. They represent an enormous weight of evidence, and your shrill denunciations (“Hockey stick fake consensus,” “secret recycled proxies”) show a remarkable unwillingness to entertain the actual science. You dismiss the weight of this science at your peril.
It’s easier to dismiss than engage, but the discussion will be a lot more productive and useful if we all assume that there are smart, honest people working on both sides of this debate with a genuine and substantive disagreement.
Excellent, John, thank you and apologies.
So the issue is: even Bjorn Lomborg sez there is an anthropogenic component to the recent warming. This is more evidence on the pile. Thank you for pointing it out.
Best,
D
Dano – quoting Lomborg? There may be hope for you after all…
There’s no doubt it’s warming, but the questions are:
1. Why?
2. Is it bad?
3. Can we “save the planet” if need be by some more cost effective solution, especially since we have but a smidgeon of the computational ability that’s needed and really have no answers. I mean, if “the experts” can’t even agree on what’s happened in the past how can they project what’s going to happen in the future? That takes us back to #’s 1. and 2…
But back to the issue at hand, which is entirely separate of whether or not it’s warming. The question is what kind of science – no, the question is “is it science at all” that the Hockey Team is promulgating. We know that although they didn’t admit it, these guys are buds with Mann, used his data (selectively, I might add) and came up with a slightly more “conventional” result than Mann, who was able, with his simulation of scientific enquiry, to come up with the same thing that happened here, in Figure 1. That’s taken as fact by anyone familiar with the procedure, except, of course the softball guys over at Realclimate, who censored my follow up questioning on that, and further questions as well. So, I think, especially since Science Magazine was involved there too, we can consider there is Hwanging (aka belief systems as opposed to verification) going on in climate science – on *both* sides.
Do you agree?
Steve H
—————————————————————-
“The improver of natural knowledge absolutely refuses
to acknowledge authority, as such. For him, scepticism
is the highest of duties; blind faith the one unpardonable sin.”
Thomas H. Huxley
—————————————————————-
Steve H –
Just a reminder on the ad hominens: “these guys are buds with Mann”, “simulation of scientific inquiry”, “anyone familiar with the procedure, except, of course the softball guys over at Realclimate”, etc. Not helpful. If you can’t recognize these as serious and honest disagreements (as you’ve been able to do in other useful discussions here), perhaps you’d best just take it elsewhere.
Mea Culpa. Just a little leftover hostile reaction. I can certainly play by the same rules as everybody else.
🙂
Here’s an eye-opener. Going to Stephen McIntyre’s site he has a list of 100 random series he put into the MBH98 procedure. I graphed the results here
Look familiar?
*Random Numbers*
Steve H –
It’s worth remembering in this regard that Hans von Storch concluded otherwise – that the Artificial Hockey Stick, as alleged by M&M, is not in fact a problem in the MBH methodology.
I’d like to see a reference to that. Von Storch said in Der Spiegel “We were able to show in a publication in Science that this [hockey stick] graph contains assumptions that are not permissible. Methodologically it is wrong: Rubbish [or Junk*].”
* From the German phrase Quatsch
And, very politely in Science magazine, he said
“The centennial variability of the NH temperature is underestimated by the regression-based methods applied here”
Again, you’re barking up the wrong tree. Mann’s error isn’t about whether or not Earth is warming, it’s about corruption of science. A problem of much larger magnitude.
And, again, look at the curve Mann’s procedure gets with random numbers. Does that appear to be random to you? That’s the ultimate, simple, question.
“Corruption of science”? You really can’t resist, can you? 🙂
Two separate issues:
1) Automatic Hockey Sticks: von Storch says no, that it doesn’t happen with the MBH methodology. In other words, he’s saying the methodology of M&M’s critique (and therefore the methodology used to create the data set you graphed) is wrong on this point. That’s VS’s answer to your “ultimate, simple question.” (For the reference, click on the link I provided above – this is the GRL paper I referenced in the last thread in which this came up. VS makes clear that he doesn’t like Mann’s methodology, but that his red noise experiments come to a different conclusion than M&M’s.) I’m not saying VS is necessarily right here, merely that M&M’s contention on this point cannot be accepted as a trivially true indictment of MBH. But what we have here is a methodological dispute of the sort that are common in science, not a “corruption of science.”
2) Underestimated centennial variability: von Storch says yes. So do a number of other studies. That’s what he’s talking about when he calls it methodological rubbish. That was the point of his Science paper. Not that MBH creates artificial hockey sticks, but that their method would
underestimate centennial-scale variability. Other proxies show similar results, especially Moberg’s, with greater variabilities at centennial scales that MBH. I think the weight of the evidence tends to tip in the direction of VS and Moberg at this point, but it’s by no means settled. But if MBH turn out to be wrong here, it’s a normal methodological disagreement among honest scientists working on a hard question, not a “corruption of science.”
Again: if you want to have a discussion about honest methodological disagreements, or the implications for our understanding of climate if MBH is right or wrong, great. If you want to sling accusations of “corruption of science,” could you take it elsewhere?
Leaving alone for the moment the underestimated centennial variability which creates alarmism, where did von Storch say that? Got a link? Or are you just referring to the fact tha one can theoretically fit a straight level line through a href=”http://myweb.cableone.net/shemphill/randomsintombh98.jpg”>this graph?
I have neither seen nor heard anyone successfully counter M&M’s math, but I have heard it said it’s not automatic *because* one can fit a straight level line through the graph.
Oops – typo. this graph
I repeat: click on the link I provided above. It’s in the entry where I first mentioned this, right before the one where you said, “I’d like to see a reference to that.” 🙂
John F said: “von Storch says no, that it doesn’t happen with the MBH methodology”.
That’s not what Von Storch and Zorita say. they say, in your link, “very often the leading PCs show a hockey stick pattern, even if the data field was by construction free of such structures.”
They also say, at the end, “indicate therefore that the AHS does not have a significant impact but leads only to very minor deviations. We suggest, however, that this biased centering should be in future avoided as it may unnecessarily compromise the final result.”
What is significant? Significant in terms of “global warming” is different than significant in terms of scientific robustness.
Again, the hockey stick is the little picture. Science is the big picture. You and I are talking apples and oranges. I’m talking about Science itself.
One further question: According to the links you provided, the MBH98 method is biased in more ways than one. Why is it that Mann refuses to acknowledge that?
I agree. Science is the big picture. I think the ongoing testing and arguing about the various methodologies for producing paleoclimate reconstructions is an example of healthy science.
One of the useful approaches seems to me the performance of comparative studies of various methodologies. A doctrinaire reliance on the methodology from MBH’s original papers would be a bad thing. The important thing is to see how the answers change given the various methodological assumptions (and these include not only the statistical methodologies, but also questions regarding seasonal and spatial variability, issues that also throw monkey wrenches into the global paleoclimate works).
With that in mind, a couple of good papers along those lines worth reading:
Proxy-Based Northern Hemisphere Surface Temperature Reconstructions: Sensitivity to Method, Predictor Network, Target Season, and Target Domain, Journal of Climate, 1 July 2005
Testing the Fidelity of Methods Used in Proxy-Based Reconstructions of Past Climate, Journal of Climate, 15 Oct. 2005
Dear John
you are after reasoned scientific discussion. Here are a few points, shamelessly stolen from climateaudit
1) the crux of science is replicability. You cannot replicate the O&B study, because several of their data sources are not publically available.
2) One of the key issues is how you choose your proxies to get the data set to analyse. I am not convinced but there is substantial subjectivity in the process of choosing these proxies.
Let me give you an example. If I choose, randomly, 12 red cars, I can do all the complicated statistics I like, and it will always tell me that the cars are red. Yet it would be foolish to infer that all cars are red; we know this is not so.
By having subjectivity in the selection process, it is possible to go for proxies which are “red cars”.
3) many of the proxies chosen by O&B have been used extensively in hockey-stick studies before. Why is it surprising that proxies which give a hockey-stick in one study give a hockey-stick in a similar study ?
4) Can I ask you if they are formally looking at temperature (as suggested by yourself) or merely the response of proxies ?
yours
per
As we explained in our Reply to von Storch and Zorita and amplified on climateaudit, VZ did not replicate MBH methods but did simulations. Their simulations did not replicate MBH Pc methodology since they did not do PC on a decentred data matrix, but on a correlation matrix on decentered data – there’s an important difference which we adverted to in our first article, but VZ missed. Second, they assumed that the proxies were way better than they really are and effectively ruled out the potential impact of “bad apples” such as bristlecones. Their misunderstanding is frustrating. However, for the benefit of those who may think otherwise, I am on cordial terms with both von Storch and Zorita.
Steve M –
Thanks for the comment. To be clear, I was not trying to argue that I think VZ’s proven you wrong, merely that the disagreement on this point among the various experts involved in the debate should be viewed by outsiders such as myself (and Steve H) as evidence of vigorous and healthy methodological debate. The cordial nature of your disagreement with VS and Z is evidence of this.
Per –
Thanks for the substantive comments. I’m especially interested in the criticism of proxy selection. My understanding of the paleoclimate record would be greatly aided by someone taking this argument in an affirmative direction, rather than using it soley as a negative critique. Given the available proxies, how might one select in an unbiased fashion? What might the criteria be, who has done it, and what has it shown?
And you’re right, of course, I spoke too losely when I said they were looking at temperature. 🙂
Dear John
part of the science is just finding out the strengths and weaknesses of your methods.
Climate audit has some really good analogies from the stock market. There are a whole lot of stocks, etc., which show really good correlations with the FTSE, or future growth, within a given test period in the stock market. As soon as you take them outside that one test area, the correlation goes. As you can imagine, people have worked really hard at trying to predict the stock market; but it is thorough analysis which shows that- well, it is not as easy as all that.
As you can imagine, climate audit has a lot to say on the heterogeneity and sometimes explicit bias in the field. I think this is an issue that has yet to be addressed, and how you do it is up for grabs.
cheers
per
Per –
Thanks. What’s lacking for me in the ongoing discussion at ClimateAudit, and is implicit in my question, is the affirmative followup. OK, how should proxies be selected and what do they show when you do it that way?
That’s just a nice way of rephrasing Dano’s ‘dey ain’t got nuthin”, John.
It would be nice to see something moving beyond discussion and someone actually going out with an increment borer and writing their own paper. That might get some cred. I’ve outlined for Steve how to do this, but I see nothing beyond discussion.
Show you’re right, go out yourself and core some trees. This goes for wayward biologists too. It’s oh so easy to quibble.
Best,
d
Best,
D
Dear John
the thing about science is you have to look at what the data tells you.
I understand the story has been established in economics. All sorts of folk announced that x or Y had an astonishingly good correlation with a or b in the test zone. Outside the test zone, these correlations fell apart and they fail to predict the stock market. They were spurious predictors; I dare say it took a long time, and some heated discussion, to work this out.
With temperature relationships with trees, i rely on climate audit. The story is that it takes an awful lot of time, effort and money to get tree data. There is good evidence that some of the data that is generated is selectively archived (the ones that give the good result in the test zone). You can maybe understand why that happens, but it is still profoundly disturbing; it means that some of the tree data is seriously biased.
There is good evidence that some of the tree data fails to show a linear relationship with temperature. The bristlecone pines (relied upon so heavily by MBH’98) were originally characterised as failing to show a relationship with temperature in the 20th century.
Steve Mc highlights a major analysis by Briffa of tree growth, wherein you see a decline in ring-widths post 1960, in a time of increasing temperature. Prima facie, this undercuts the basis for using tree ring-widths as a proxy for temperature.
If you are trying to use a proxy, you have to insist on having a non-biased data set to start with. If you only archive the trees with high 20th century growth, and bin the series with low 20th century growth- that is bias. You need to be able to compare a non-biased data set with temperature to show that there is a meaningful correlation; not cherry-pick only those data sets that show correlation and hide the rest. And you then need a method for randomly selecting non-biased data sets for your reconstruction.
I appreciate your points about being constructive, but identifying the parameters which you need to satisfy for doing a temperature reconstruction is essential for having a robust reconstruction. This is what steve does at climate audit. If it should turn out that some of the proxies and reconstructions don’t meet the necessary requirements, it is much better to know that than act on information which is wrong; don’t shoot the messenger.
yours
per
I don’t know if it is helpful, but my take on the PCA analysis.
What SM showed was that if you take 100-odd noisy but flat lines, and subject them to the decentred PCA analysis, the decentring method introduces a small but significant bias- a hockey stick.
If you do the same procedure to 100 series which have a signal- for example flat lines with a big hump in the middle, the bias induced by the decentred PCA will be much smaller than the signal from the hump in all the data.
So explicitly; if you have samples with a big signal- the decentred PCA is a tiny and irrelevant effect. If you have samples with little or no signal, the bias introduced by decentred PCA becomes the biggest effect.
VS&Z did a study where they had large signals- they define them as such. SM’s case is that most of the proxies in the north american PC1 in MBH98 are just a flat line with no signal; and that the gaspe cedars, which are hockey-stick shaped anyway, account for ~40% of the signal under de-centred PCA. So there is very little signal, and what there is is hockey-stick shaped and exaggerated by the algorithm.
You can be very clear about the effect with flat lines, ‘cos that is what SM published with a simulation using random numbers. You can be very clear that if there is a big signal, the bias with decentred PCA is small. Everyone agrees on these. Where MBH is on that continuum between noise and signal is analysed in SM’s GRL’05 piece, though I dare say MBH would find it contentious.
yours
per
The key is for others to find the same thing, which is the thing about science. One guy who couches his findings in angry rhetoric does not a revolution make.
The other key is for people to take this information and test it in the field. Little Johnny A-types can complain all they want about limited proxies – simple fix: you look like a whiny fool until you go out and collect some data yourself. That’s no argument.
Best,
D
Little Johnny A-types?
Not the hot blues guitarist, but the talking point enabler.
Best,
D