Update: I’ve added a post with a better seasonal precip map than the one below:
*****
As we close in on the end of the current water year, the US Bureau of Reclamation has reported what passes for good news these days on the Colorado River.
This month’s forecast for year-end storage levels in Lake Powell is up 340,000 acre feet from those made a month ago. At a projected 15.41 million acre feet of water in storage Sept. 30, that’s still below last year (15.46 maf), but it’s looking considerably better than it was as recently as April, when the Bureau was forecasting a big drop. Small drop better than big drop. As I said, this is what passes for good news.
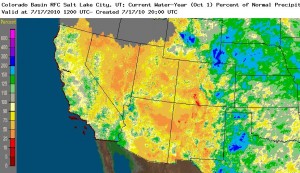
The reason Powell is dropping (and Mead downstream, though explanations there are more complicated) is clear in this map from the Colorado River Basin Forecast Center, which is pretty self-explanatory. (Yellows, oranges and reds are dry, click on the image to embiggen.) It’s as if the wet line rolled east off the continental divide, with all the precip to the east, on the plains, and pretty much the entire Colorado River Basin dry.
I like the blobs of green on the Lower Colorado. Wet year in Yuma! But that portion of the basin contributes so little to the river’s flow that it’s a percentage increase on almost nothing to begin with. Double Yuma’s usual annual precip of near zero is still near zero. Most of that came in the big January storms.
This comes as the folks at the Climate Prediction Center have issued a seasonal drought outlook for dry weather across the southwest. The reason is a lackluster monsoon and a looming La Nina, according to CPC head Wayne Higgins:
“If the monsoon remains erratic during the next few weeks, then the drought development area may be expanded on the updated outlook scheduled for August 5,” said Wayne Higgins, director of the NOAA Climate Prediction Center.
Factors leading to the forecast of enhanced chances for drier-than-normal conditions in the Southwest during the above periods include coupled ocean-atmosphere global climate forecasts and historical conditions during the late summer when transitioning from El Niño to La Niña.
“Beyond this time period, expected dryness associated with established La Niña conditions may bring further expansion of drought conditions in the Southwest during the 2010-11 winter season,” Higgins said. La Niña may also provide wetter-than-normal conditions in the Pacific Northwest during fall 2010 and winter 2010-2011.
At this point I’m not prepared (in terms of the journalism I’ve done or my understanding of the

Courtesy Climate Prediction Center
science) to make a huge deal about the La Niña forecast in terms of the Colorado River. The folks at the Colorado Basin River Forecast Center publish correlations for all their rivers between ENSO (La Niña and El Niño) and river flow. For you climate data nerds, the R^2 value of the correlation between flow into Lake Powell and the ENSO 3.4 SST is 0.0022. For non-nerds, that roughly translates as “La Niña doesn’t help us a whole lot in making a forecast.” The reason is that the area where La Niña is linked to drought lies south of the Colorado River headwaters region. See, for example, this long lead forecast map for Nov-Dec-Jan 2010-11 to the right.
For those who have been following the (to me at least) fascinating question of whether all of this dry will lead to record low levels on Lake Mead this year, the answer seems to be “no”. The current USBR forecast calls for Mead to end the year with a surface level of 1084.97 feet above sea level. That will be the lowest Sept. 30 level since 1936, when the reservoir was first filled. But it is still above the previous trough of April 1956 (1083.81). It looks like we could flirt with that record level by November of this year, though.
As a journalist, for storytelling purposes, that historic 1083.81 matters to me a lot.


John, how does demand on Lake Powell today compare to 1956, and does that matter? I don’t have a good sense of how much drawdown there is from such a huge source…. or is it too little to influence year-to-year levels?
David –
Lake Powell hadn’t been built in 1956. I took a quick look at the available historical data re Lake Mead (which you probably meant) and the easy-to-find stuff only goes back to the 1970s. At that time Upper Basin demand was far lower, but and Lower Basin demand was actually quite large even then. But I’ll find the historical data and do a post….
Oops, sorry. I guess, in general, my question is on how water demands on these lakes today compare to back them (’70s or earlier), and if this is a significant component of water levels….
Pingback: River Beat: Western Precip Update : jfleck at inkstain