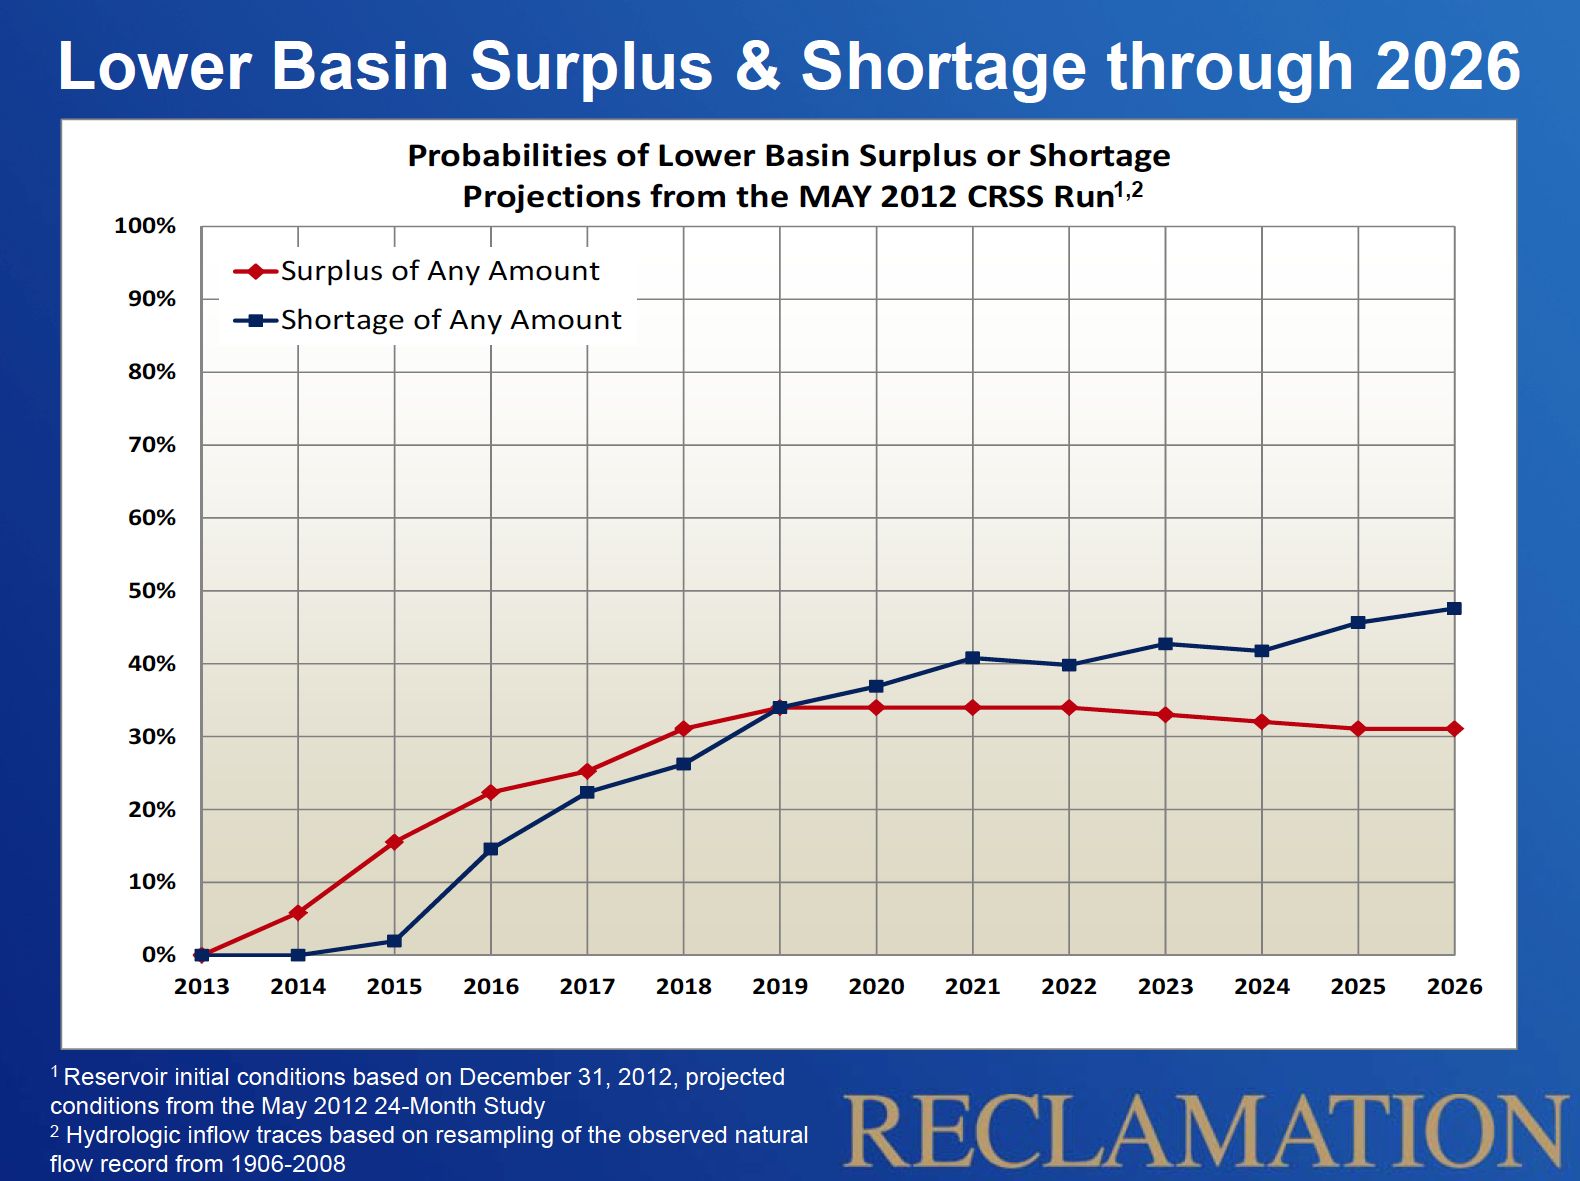
I know it is in the mission statement of all card-carrying western water journalists to harp on the gloomy prospects of shortage. But in the near term, the odds of a surplus on the Colorado River are greater than the chances of a shortage, according to new calculations by the US Bureau of Reclamation.
Don’t worry, though, I’ve still got a gloom card to play, as by 2019, the lines cross, and there is a nearly 50 percent chance of shortage by 2026.
The new calculations are based on the current forecast for storage in the big reservoirs of Lake Mead and Lake Powell at the end of this year, and use an ensemble of possible wet years and dry years, based on the 1906 – 2008 flow record.
We have to be careful to define exactly what we mean here by “shortage” and “surplus”. These are terms that are defined with Byzantine precision in the Colorado River Interim Guidelines for Lower Basin Shortages and the Coordinated Operations for Lake Powell and Lake Mead. A shortage occurs when Lake Mead’s surface elevation drops below 1,075 feet above sea level. As I’m writing this, it’s at 1,119.85, and it’s forecast to end the calendar year (the starting point for this calculation) at 1,118.26, per the latest monthly forecast (pdf). So another 33 feet until a “shortage” is declared, at which point Nevada (really Las Vegas) and Arizona see supply reductions.
Surplus is defined as Mead rising to about 1,145. We don’t talk about this as much, because we like to be all scary and drought-mongering, but as you can see from the graph there’s a greater chance of surplus than of shortage over the next few years. In a surplus condition, Arizona, Nevada and the Metropolitan Water District of Southern California all get bonus water. The last time Lake Mead had that much water was 2003.
The caveat – this calculation is the odds if past is prologue – that is, if the past range of variability over the previous century captures the variability we’re likely to see. To the extent climate change may be at play in the near term, you should adjust your thinking accordingly (push the shortage graph up a bit, and the surplus graph down a bit?).
The graph goes out to 2026 because that’s the “interim” in “Interim Guidelines”.
The Upper Basin doesn’t show up here because we Upper Basin users (I’m drinking Colorado River water here in Albuquerque as I write this) aren’t covered by this whole shortage/surplus scheme. We’re still not using our full share of the river’s water, so don’t worry about us, we’ll be fine.
Thanks to Carly Jerla and Paul Williams Miller at the Bureau for kindly sharing the graph, which Paul included last week in his presentation at the Tahoe Science Conference.
update: fixed error in Paul’s name – apologies to Paul for getting the name wrong, and thanks to an anonymous reader for pointing it out


Pingback: Hookers and blow on the Lower Colorado – boring wonky back story : jfleck at inkstain