
Before I went on the Children’s Hour this morning on KUNM (archived for now here, go to June 20, 9 a.m.), I looked at a few graphs. Here’s the first – Albuquerque precipitation since Oct. 1. It’s the accumulated precip on the Y axis, date on the x. The brown line is mean, the green line is actual:
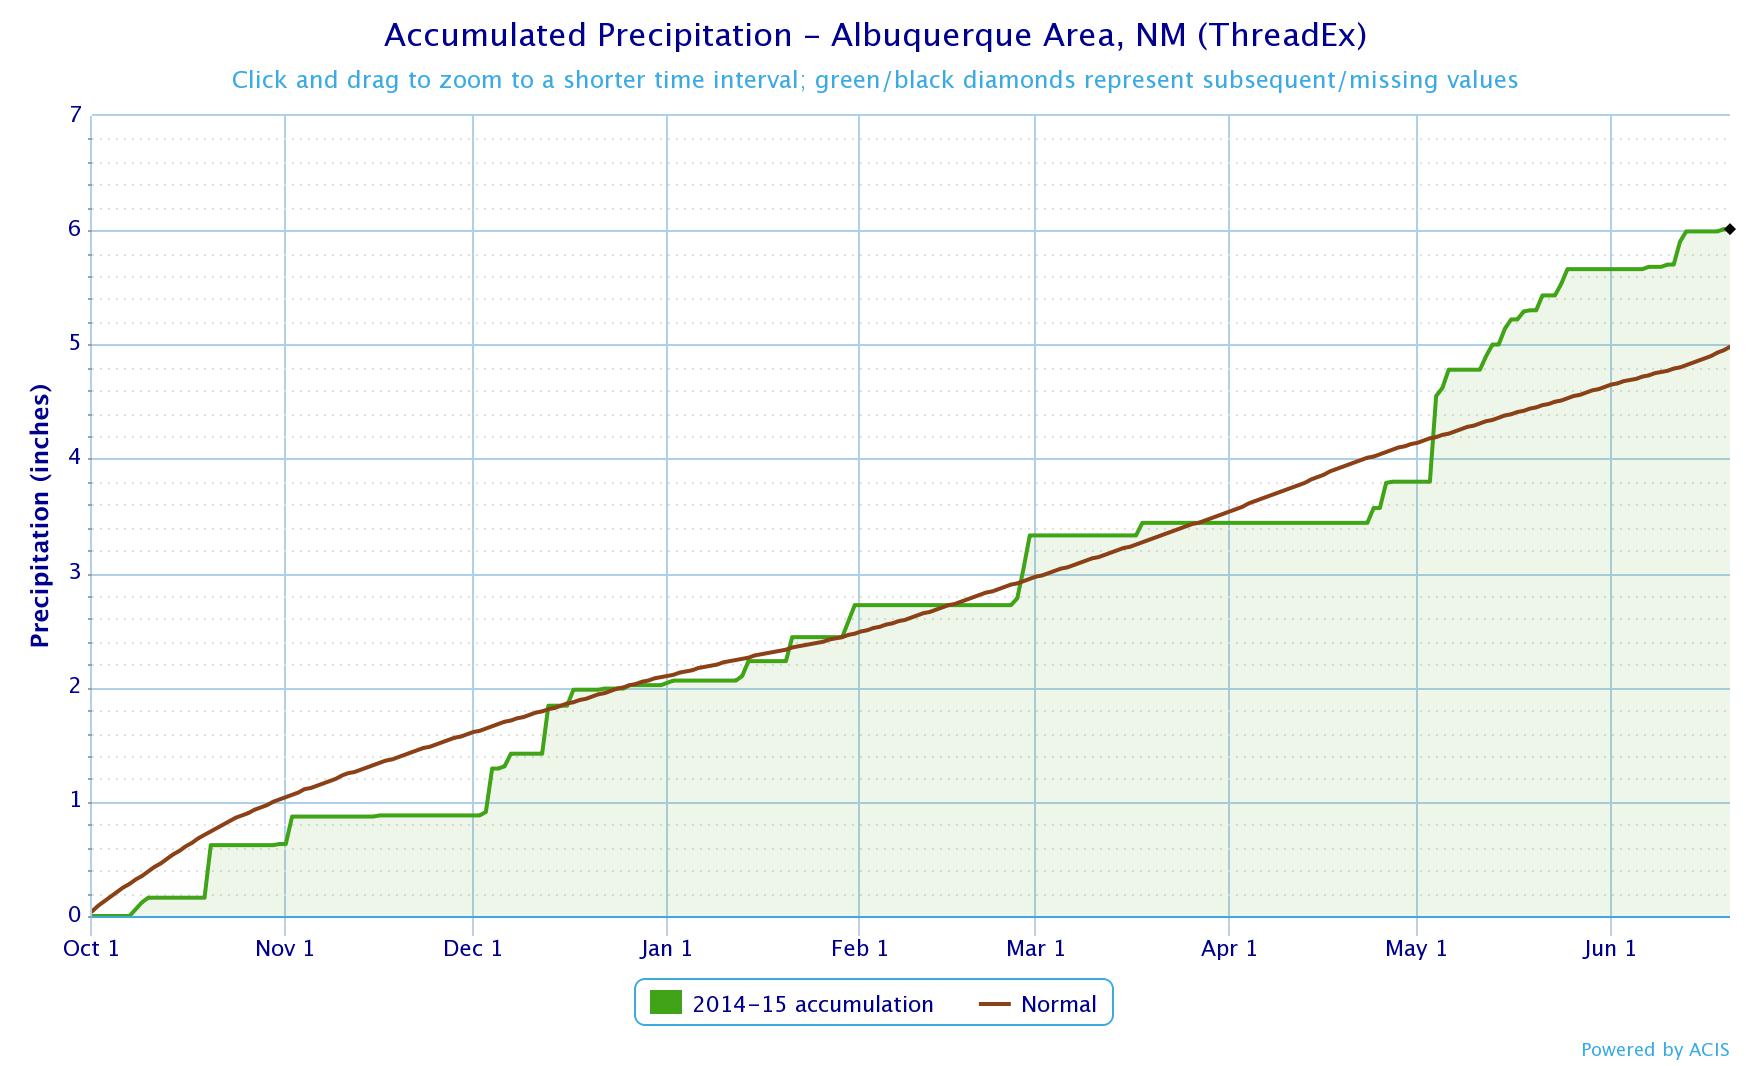
Albuquerque precip, water year to date
Kinda wet since early May, as you can see, and definitely above average for the water year. But is “the drought” over? That was Katie Stone’s question to me when she invited me on.
It was a setup. Neither she nor I think “the drought” is “over”. Here’s a key bit of graphy evidence. It’s the 12-month average Palmer Drought Severity Index for New Mexico as a whole. Palmer is a statistical oddity about which details don’t matter, beyond the fact that it pairs both precipitation and temperature, and does a useful job of integrating over time. By adding spatial aggregation (instead of just Albuquerque, I’ve grabbed the statewide PDSI number), you can get a feel for broad drought conditions over longer periods of time and larger spatial areas, which is what really matters. Yellow is bad:
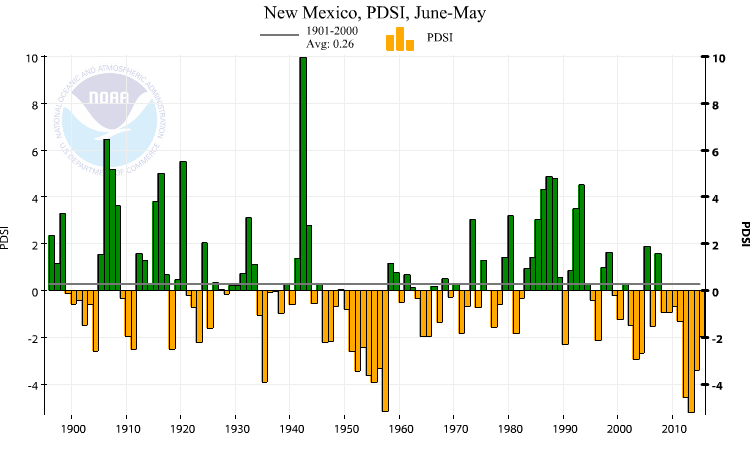
12-month PDSI, New Mexico
The key bit is that we’ve only had three years since 1999 that have green bars. The rest are yellow. More dry than wet. So if the long term water availability is what matters to you, like if you’re a tree with deep roots or a farmer depending on the still-mostly-empty Elephant Butte Reservoir, this graph suggests a big hole out of which to dig.
Big thanks to Katie for having me on. The Children’s Hour is a great New Mexico institution – a fun show, but taking its mission of education seriously.
The KUNM audio was for the entire day!
Judy – There’s a pull-down menu that lets you pick the time. 9 a.m.
I should have been able to figure that out!
Look at 1942, tho! The cattle must have been floating down the creeks and rivers.