
By Jack Schmidt, John Fleck, and Eric Kuhn
On the eve of the release of the US Bureau of Reclamation’s August Colorado River reservoir forecasts – freighted with meaning this month because of Reclamation’s ultimatum to the states about the need to cut water use – we look back at the last four decades of water-supply management to pose the central question:
How did we get into this mess? Our answer in brief:
When the Colorado’s flow was up, we used it all.
When it was down, we drained the reservoirs.
The river’s natural flows have been down for a long time.
And during the few stretches of somewhat higher flows, we did not significantly refill the reservoirs.
A failure to set water aside for the future
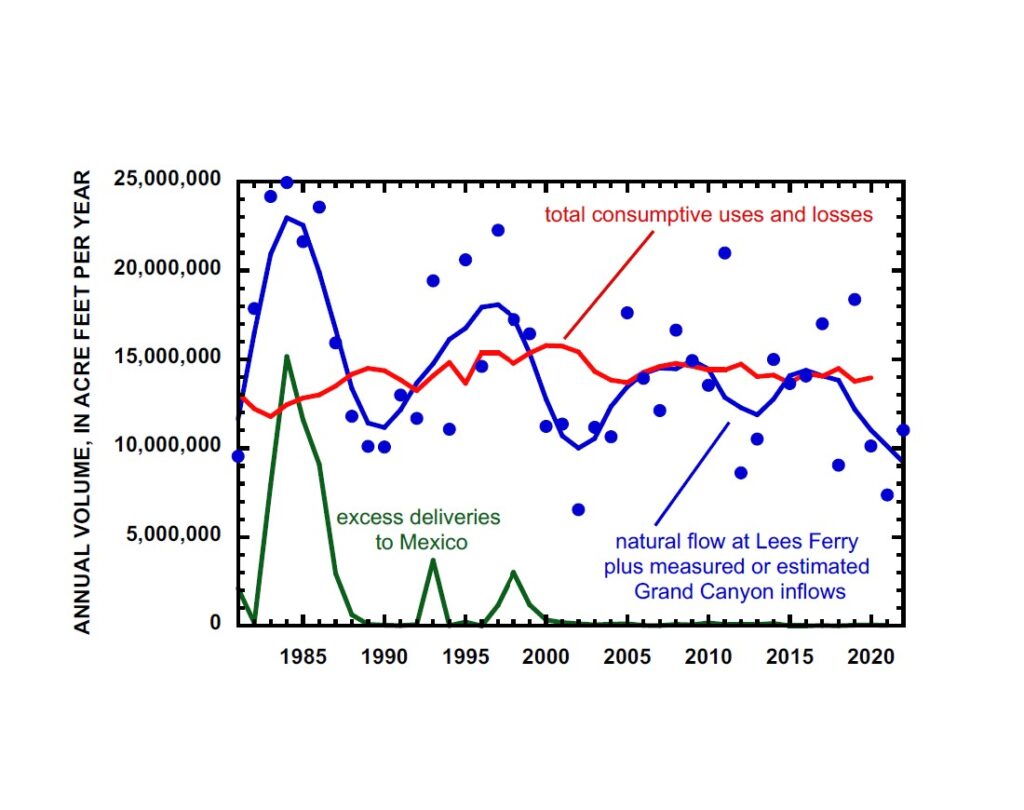
Colorado River water use outpacing supply. Graph by Jack Schmidt, Utah State University
Operating year to year, it is easy to get lost in the river’s annual ups and downs, and the immediate desire to get water to farm fields and cities – THIS YEAR! NOW!
But the longer view, based on the best available data, makes clear our mistakes during the past 20 years. Since the year 2000, the blue line in the graph above has spent little or no time above the red line. That is water use outpacing supply.
The result – the most recent three consecutive dry years have left us with headline-clear problems:
- Reservoir storage is 66 percent less than it was in 2000.
- Reclamation is concerned about the structural integrity of the river outlets at Glen Canyon Dam that will be continuously needed if Lake Powell falls below the minimum power pool elevation.
- Las Vegas’s old water supply intakes – and dead bodies! – are emerging from the Lake Mead mud.
21st century Colorado River water use has exceeded supply by 1.2 million acre feet per year
The graph’s nuances are worth noting.
Blue dots represent each year’s total natural water supply – the sum of the natural water yield of the entire Upper Basin and of the many springs and tributaries that flow into the Colorado River in the Grand Canyon. This natural supply, not considering the Gila, Bill Williams, or Virgin Rivers, averaged 12.8 maf/yr (million acre feet per year) in the 21st century, 23% less than the average between 1981 and 1999.
To help visualize longer-term trends and cycles, we statistically smoothed the data to create the blue line, which more clearly shows the longer-term ups and downs of the Colorado River’s flow. The smooth line makes clear the wet periods of the 1980s and 1990s, and the deep droughts of the early 2000s and of today. Importantly for our current mess – the “wets” of the 21st century were not as wet, and the “drys” were drier, than those of the late 20th century.
The red line – total basin water use and reservoir evaporation loss (not including uses and losses in the Gila, Bill Williams, Virgin, or Little Colorado watersheds) – crept up through 2000 as the Central Arizona Project finally grew into the paper water allocations of the 20th century Law of the River.
Total consumptive uses and losses, including treaty deliveries to Mexico, peaked in 2000 at ~15.8 maf and were reduced during the next 2 years. Thereafter, average basin-wide consumptive uses and losses remained ~14.2 maf/yr between 2003 and 2020, and individual years were consistently within 4% of the average of that period. Throughout the 21st century, total Upper Basin uses and losses were ~30% of the basin-wide total.
Sustained consumptive uses and losses that exceed the natural supply can only be sustained by draining the reservoirs – but only so long as there is available water in the reservoirs. Thus, it is no surprise that the 21-year average (2000-2020) rate of water consumption and losses that exceeded the natural supply by ~1.2 maf/yr led to today’s crisis.
There were a few opportunities to rebuild reservoir storage, especially in 2005, 2008, 2009, 2011, 2017, and 2019, but a decades’ long water consumption rate that exceeds natural supply is unsustainable. The reservoirs are now mostly drained.
The failure to refill
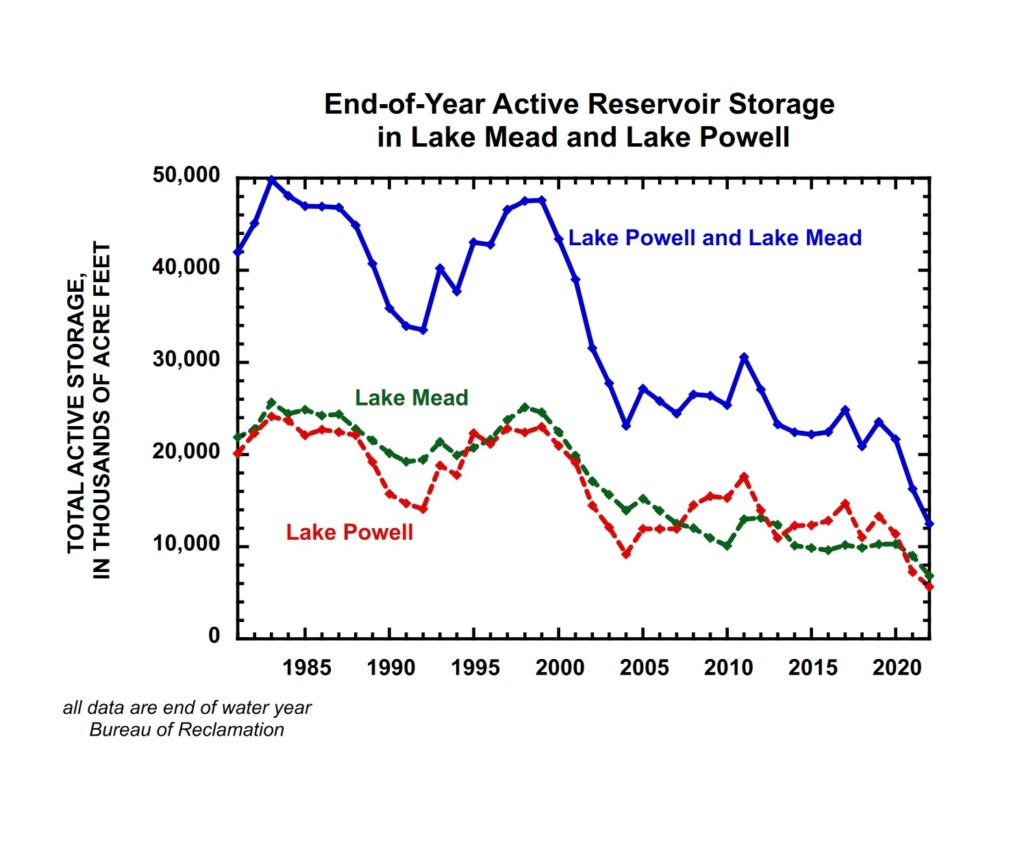
The reservoirs’ decline. Graph by Jack Schmidt, Utah State University
The history of water storage, described in the two graphs, has gone like this:
- The reservoirs were brim full in the mid-1980s and lots of water passed through the delta to the Gulf of California
- Reservoirs were somewhat depleted in the late 1980s and early 1990s when basin-wide consumption exceeded natural supply, but the reservoirs refilled in the late 1990s due to three years when supply greatly exceeded consumption (1993, 1995, and 1997). Thus, the reservoirs were relatively full in 2000 when the Millennium Drought began.
- Reservoir storage greatly decreased thereafter when the natural supply was never greater than 11.7 maf/yr (2001) and was as low as 6.39 maf/yr (2002).
- Reservoir storage stabilized at a new lower level thereafter when there were a few wetter years between 2006 and 2011. The last relatively wet year was 2019, but our continued use of large quantities of water was such that this sequence of somewhat wetter years was not used to rebuild reservoir storage.
- Natural supply has been especially low between 2020 to 2022, averaging 9.4 maf/yr, which is far less than the basin-wide consumptive uses and losses that are approximately 14 maf/yr (we note that basin-wide consumptive use data are not available for 2021.)
Thus, today’s crisis – two decades of low natural supply, including some short, very dry periods, cannot sustain consumption and losses that exceed the natural supply and that have not significantly changed since 2003.
Policy Implications
What are the policy implications of this analysis?
- There has been a natural cyclicity of somewhat wetter and somewhat drier years, but the recent wet periods, when the reservoirs might have been refilled, have not been as wet as in the 1980s and 1990s.
- The recent dry period that we are experiencing today since 2020 is comparable to the dry period of 2000-2005.
- Reductions in consumptive water use and losses mandated by Commissioner Touton will need to remain in place through the end of the present very dry cycle and well into any future wetter cycle in order to rebuild reservoir storage.
- The call for an immediate reduction of 2-4 maf/yr in consumptive uses and losses is an unprecedented reduction in relation to the pattern of use in the watershed since 2003.
- Anything less than sustained reductions of the scale demanded by Touton’s ultimatum risks crashing the system – certainly if we get another year or two of very low runoff from the Rocky Mountains.
An explanation of our methodology
The present water-supply crisis is a simple mass balance problem and we sought to describe this mass balance in the simplest way – averaging for the entire watershed
How did we consider inflows?
- We used Reclamation’s estimates of natural flow at Lees Ferry, including the provisional data that are available for 2022. We used ~40 years of data.
- We estimated inflows downstream from Lees Ferry that flow into Lake Mead based on the difference between USGS measurements made at Lees Ferry at the upstream end of the Grand Canyon and near Peach Springs, just upstream from Diamond Creek at the downstream end of the Grand Canyon. These data are available for 1990-2021, and we used the average for the 1990s as the estimated inflows of the 1980s. We used the average for the 2010s as the inflow in 2022. These data include inflows from the Paria and Little Colorado Rivers.
- We added these two data sets as the available natural supply available for water users. We did not consider the natural inflow of the Virgin, Bill Williams, or Gila River because these rivers, with only rare exceptions like year 2005, are fully depleted and considered the sole domain for use by the Lower Basin states. Note that 2001-2005, Lower Basin use of these three tributaries was 2.2 maf/yr (the last years for which these data are available).
How did we estimate consumptive uses and losses?
- We used Reclamation’s Consumptive Uses and Losses reports and Water Accounting reports
- For the Upper Basin, we used revised and peer reviewed data prior to 1995 and provisional data 1996 to 2020. Data for 2021 are not available.
- For the Lower Basin, we used Colorado River system summaries prior to 2005.
- For the Lower Basin, we used Water Accounting reports 2006-2021.
- We assumed that Lower Basin mainstem reservoir evaporation 2006-present was same as the average for 2001-2005 (1.1 maf/yr).
- We only considered Treaty deliveries to Mexico as a use, and large surplus flows of the 1980s and 1990s were assumed to have passed to the sea.
We assumed that the uncertainty of all values was 2 or 3 significant digits and rounded off our calculations accordingly.
the authors
- Jack Schmidt is Janet Quinney Lawson Chair in Colorado River Studies, Center for Colorado River Studies, Watershed Sciences Department, Utah State University
- John Fleck is Writer in Residence at the Utton Transboundary Resources Center, University of New Mexico School of Law; Professor of Practice in Water Policy and Governance in UNM’s Department of Economics; and former director of UNM’s Water Resources Program.
- Eric Kuhn is retired general manager of the Colorado River Water Conservation District based in Glenwood Springs, Colorado, and spent 37 years on the Engineering Committee of the Upper Colorado River Commission. Kuhn is the co-author, with Fleck, of the book Science Be Dammed: How Ignoring Inconvenient Science Drained the Colorado River.
Isn’t the responsibility for this fiasco; the responsibility of water users to reasonably plan for shortage?
Is this a monumental failure of Central Planning?
keep up your great work…
tom havens
Good work…thanks tom havens
You missed the impact of the mis-managed forests in the upper Basin, higher transpiration every year we allow that extra biomass to exist
You go through all that and make NO mention of Arizona threatening litigation in 2005, freezing collaboration, demanding releases from Powell be increased to 9 maf, crashing the reservoirs, all to avoid the shortages required by CRBPA. Now its too little, too late:
From a Colorado River Compact Challenge to the Next Era of Cooperation Among Seven Basin States
https://arizonalawreview.org/schiffer-guenther/
“This will relieve Arizona of the need to challenge the legality of Reclamation’s use of the 602(a) Storage algorithm that protects power generation and recreation uses in the Upper Division States. However, Arizona reserves the right to challenge future use of the 602(a) Storage algorithm after expiration of the interim period, if it reappears.”
“…releases of 8.23 MAF are insufficient to satisfy the 9 MAF mainstream water allocations of the Lower Division States and Mexico, plus the associated evaporation and other losses”
This is Arizona declaring the Lower Basin never delivers it’s half of the Article III(c) obligation to Mexico. The whole 1.5 million acre-feet plus losses getting it from the the Upper Basin to the border lands entirely on Lake Powell and the Upper Basin:
III (c) If, as a matter of international comity, the United States of America shall hereafter recognize in the United States of Mexico any right to the use of any waters of the Colorado River System, such waters shall be supplied first from the waters which are surplus over and above the aggregate of the quantities specified in paragraphs (a) and (b); and if such surplus shall prove insufficient for this purpose, then, the burden of such deficiency shall be equally borne by the Upper Basin and the Lower Basin, and whenever necessary the States of the Upper Division shall deliver at Lee Ferry water to supply one-half of the deficiency so recognized in addition to that provided in paragraph (d)
Very interesting, thanks. Is a sudden decrease in consumption of 2-4 MAF out of 13 MAF even conceivable? People can/will only cut so much.
Also, you’ve probably given this before, but what percentage of the River’s water goes to agriculture? How many MAF/yr are owed to Mexico?
Of course. The proof is in the water levels in the reservoirs.
One fix is to limit the discharge through the dams, enough to raise levels, and let the states fight it out.
The level of incompetence in the river management up to now is world class. The most action we see is volunteer groups picking up trash on the river banks.
By the way, where are Bennett and Hick on this? Not to mention our Reps. Like Boebert?
@Ed Millard: Spot on. The Feds should have ignored AZ’s pleas for the Surplus Water designations and releases.
Such valuable data and analysis. Much appreciated.
Funny how the situation has peaked in the last year. I remember this thread from twelve months ago:
https://www.inkstain.net/fleck/2021/07/is-the-colorado-river-stress-test-stressful-enough/#comments
The point here is that politics plays a major role in Water Management and that seems to be the ‘Elephant in the room’ that is ignored. Just my two cents here.
I appreciate this blog and recommend it to members of my community. However this post has a major flaw in that it glosses over the uncertainties in the data. The uncertainties in the data you use need to be quantified and included in the graphs as error bars. For example, on July 1, Powell Storage was decreased by almost .5 MAF. How could this error not have been caught by the water difference schemes? Reservoir elevation is a function of water in, water out and evaporation. They must have seen their model elevations were off by 10 feet.
This same problem created all these issues in 1922. What was known in 1922 is that we did not know the long term flows of the river. They were assumed to be ~17-18 MAF/year with the errors assumed to be negligible. The errors however were far from irrelevant, they were the whole game . If you sample the yearly river flow for 10-15 years (eg 1906-1920), the uncertainties in the mean are ~5MAF. You could say in 1922 with confidence that the long term flow of the river lay between 12 and 22 MAF/year. They should have planned for numbers lying in that range rather than assuming one number to be the truth. The is the same mistake this blog post makes. What for example are the real uncertainties in the evaporation rates, in the natural flow estimates and so on? Happy to share my error estimates with anyone who is interested why thinks this might be relevant…
Pingback: Next Steps on the Colorado River – jfleck at inkstain
Pingback: Should we worry about 8 billion people? Breaking down population’s role in the environmental impact equation - @HighCountryNews - Coyote Gulch