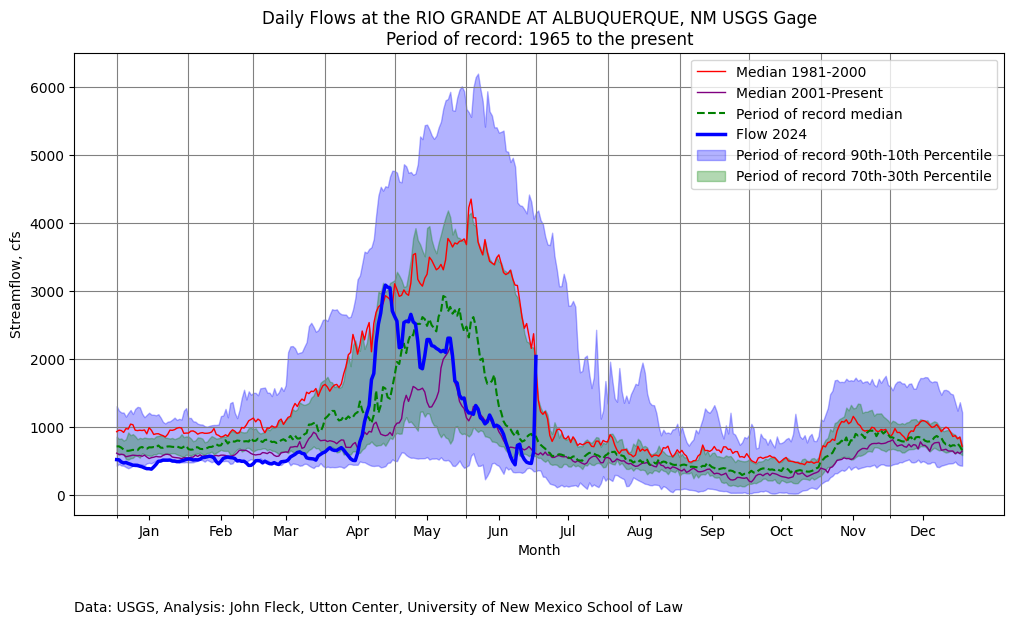
Rio Grande at Albuquerque, July 1, 2024
The graph uses day-long averages. The actual peak yesterday was over 3,000 cfs at the Central Avenue Bridge.
Here’s what it looked like around noon:
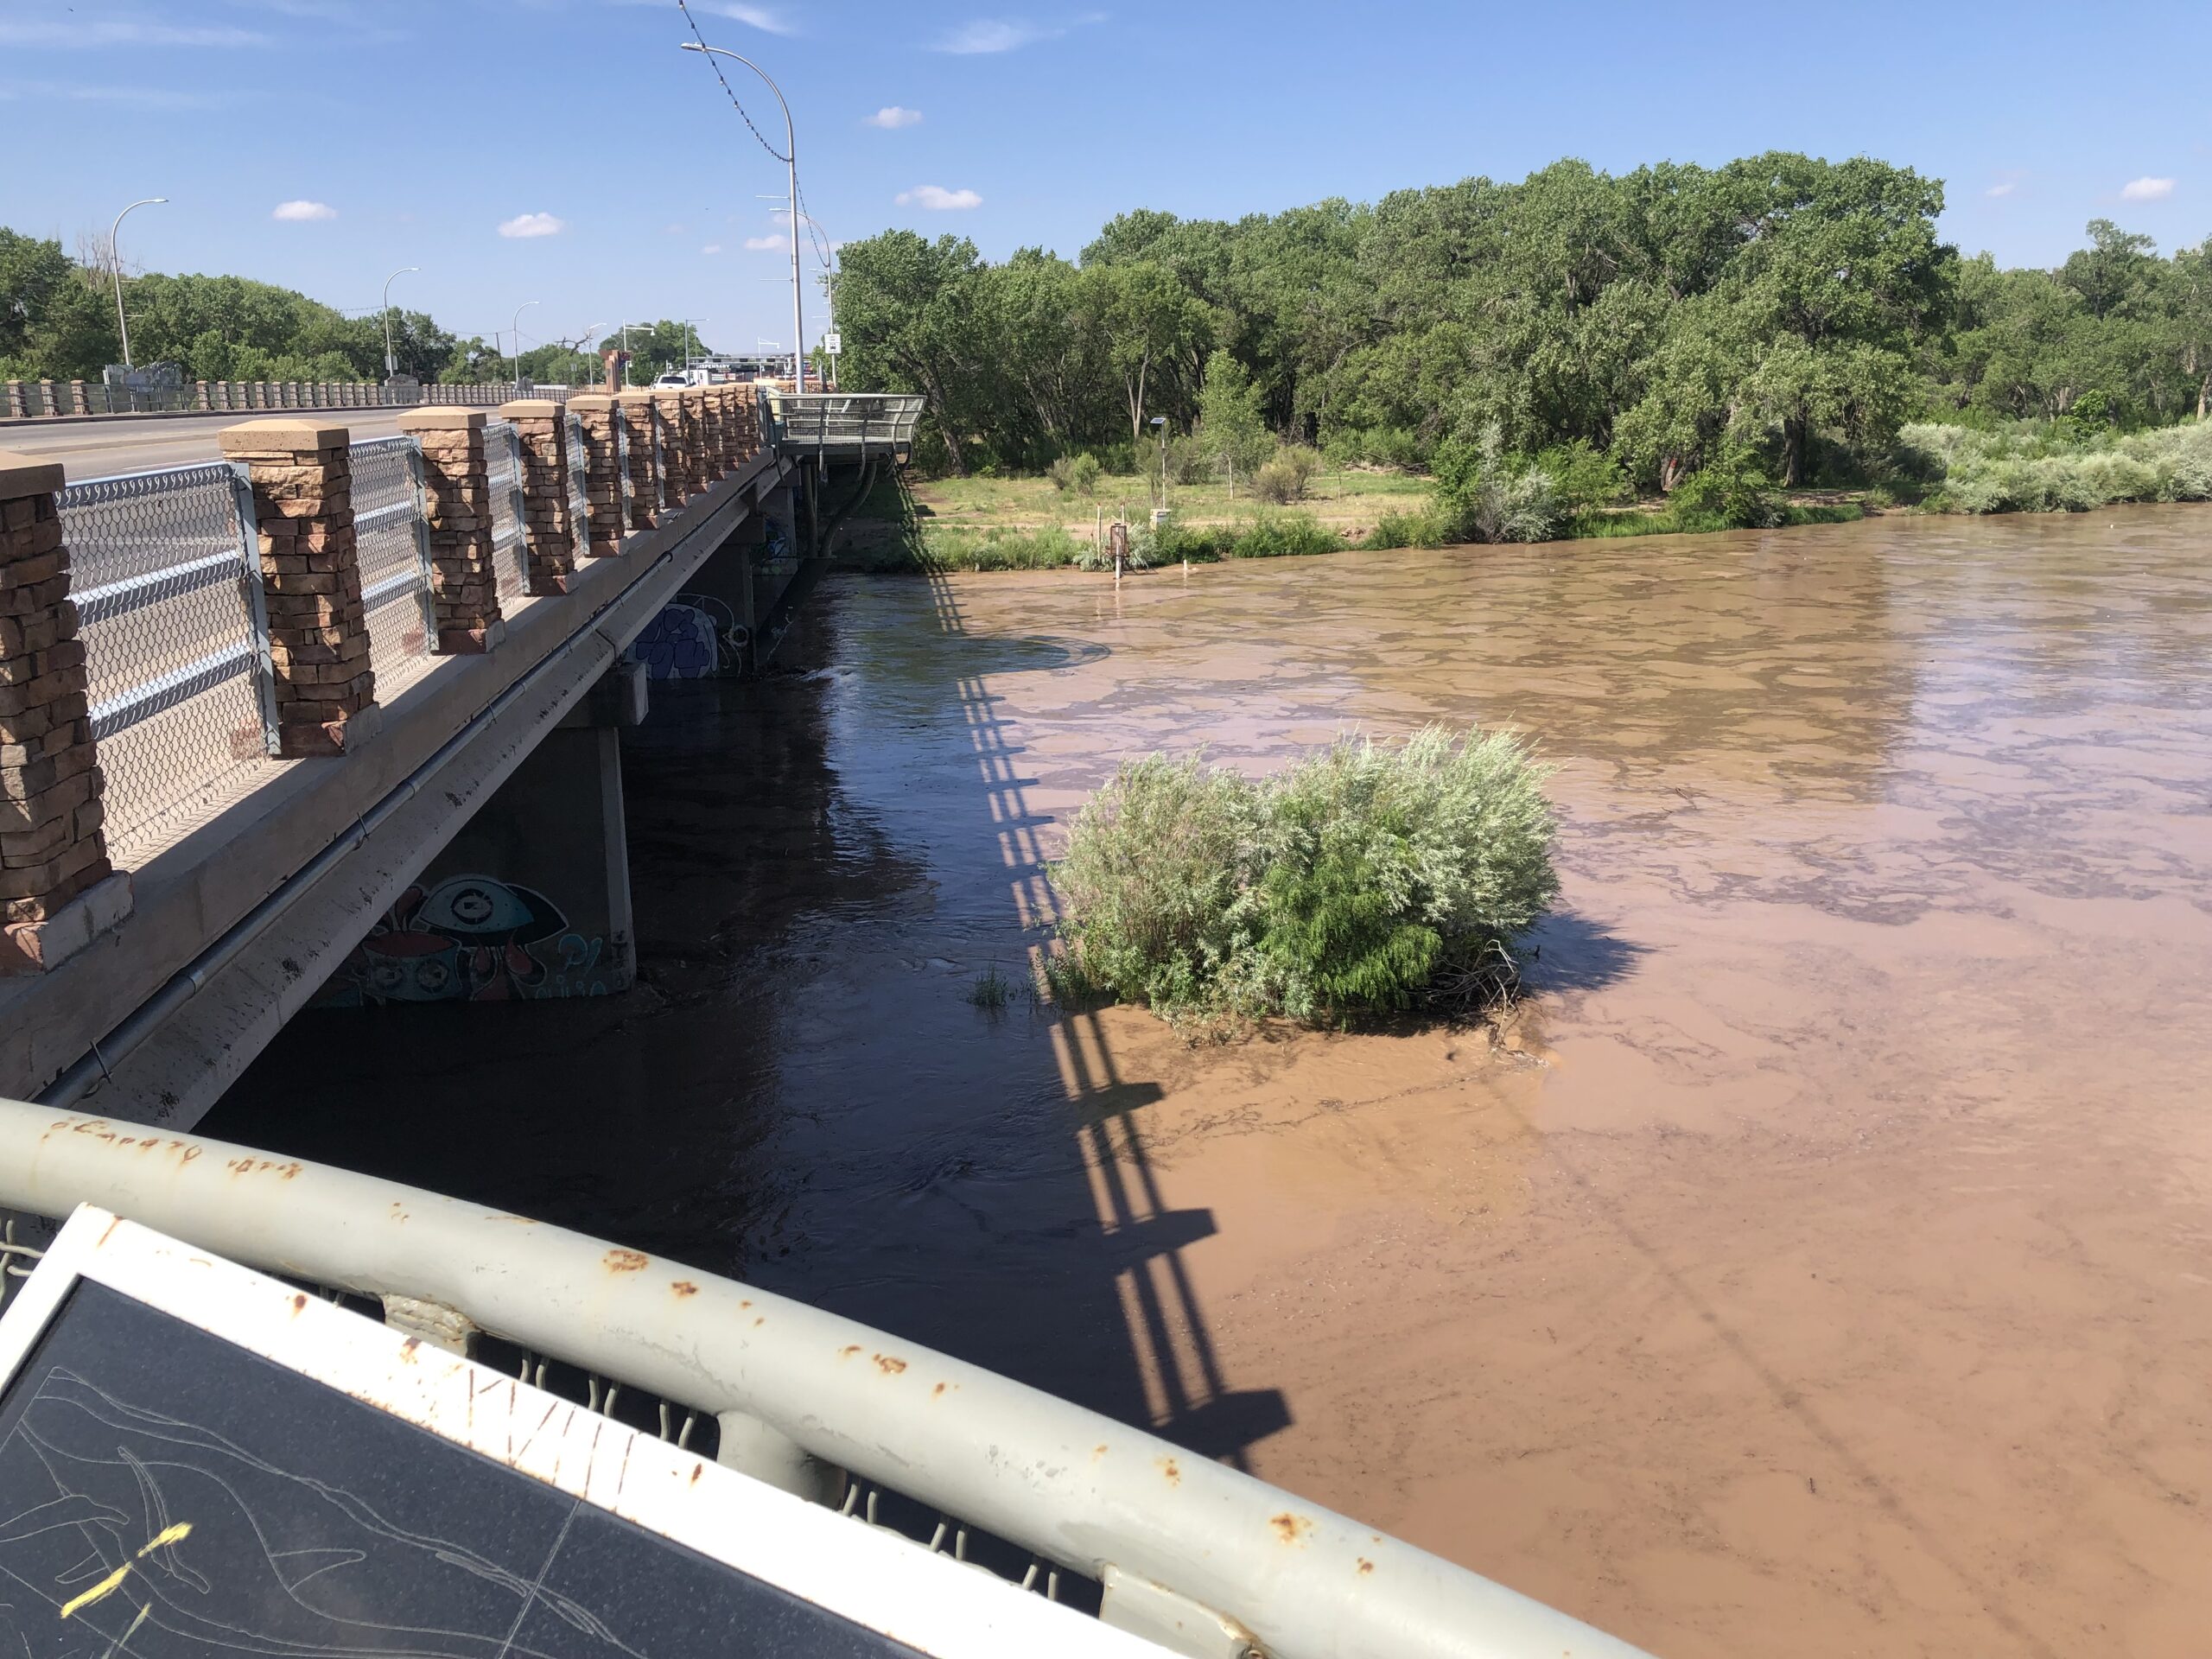
Rio Grande, Albuquerque, 10 a.m. June 30, 2024

Rio Grande at Albuquerque, July 1, 2024
The graph uses day-long averages. The actual peak yesterday was over 3,000 cfs at the Central Avenue Bridge.
Here’s what it looked like around noon:
Rio Grande, Albuquerque, 10 a.m. June 30, 2024
Boom indeed! Feel free to send any excess/unwanted monsoon rain to Arizona.
Nice graph John. Thanks. I’s like to see it as the log of the flow rate vs time. Better yet the data for the onset through the runoff period.