
a cloudy forecast
By Eric Kuhn and John Fleck
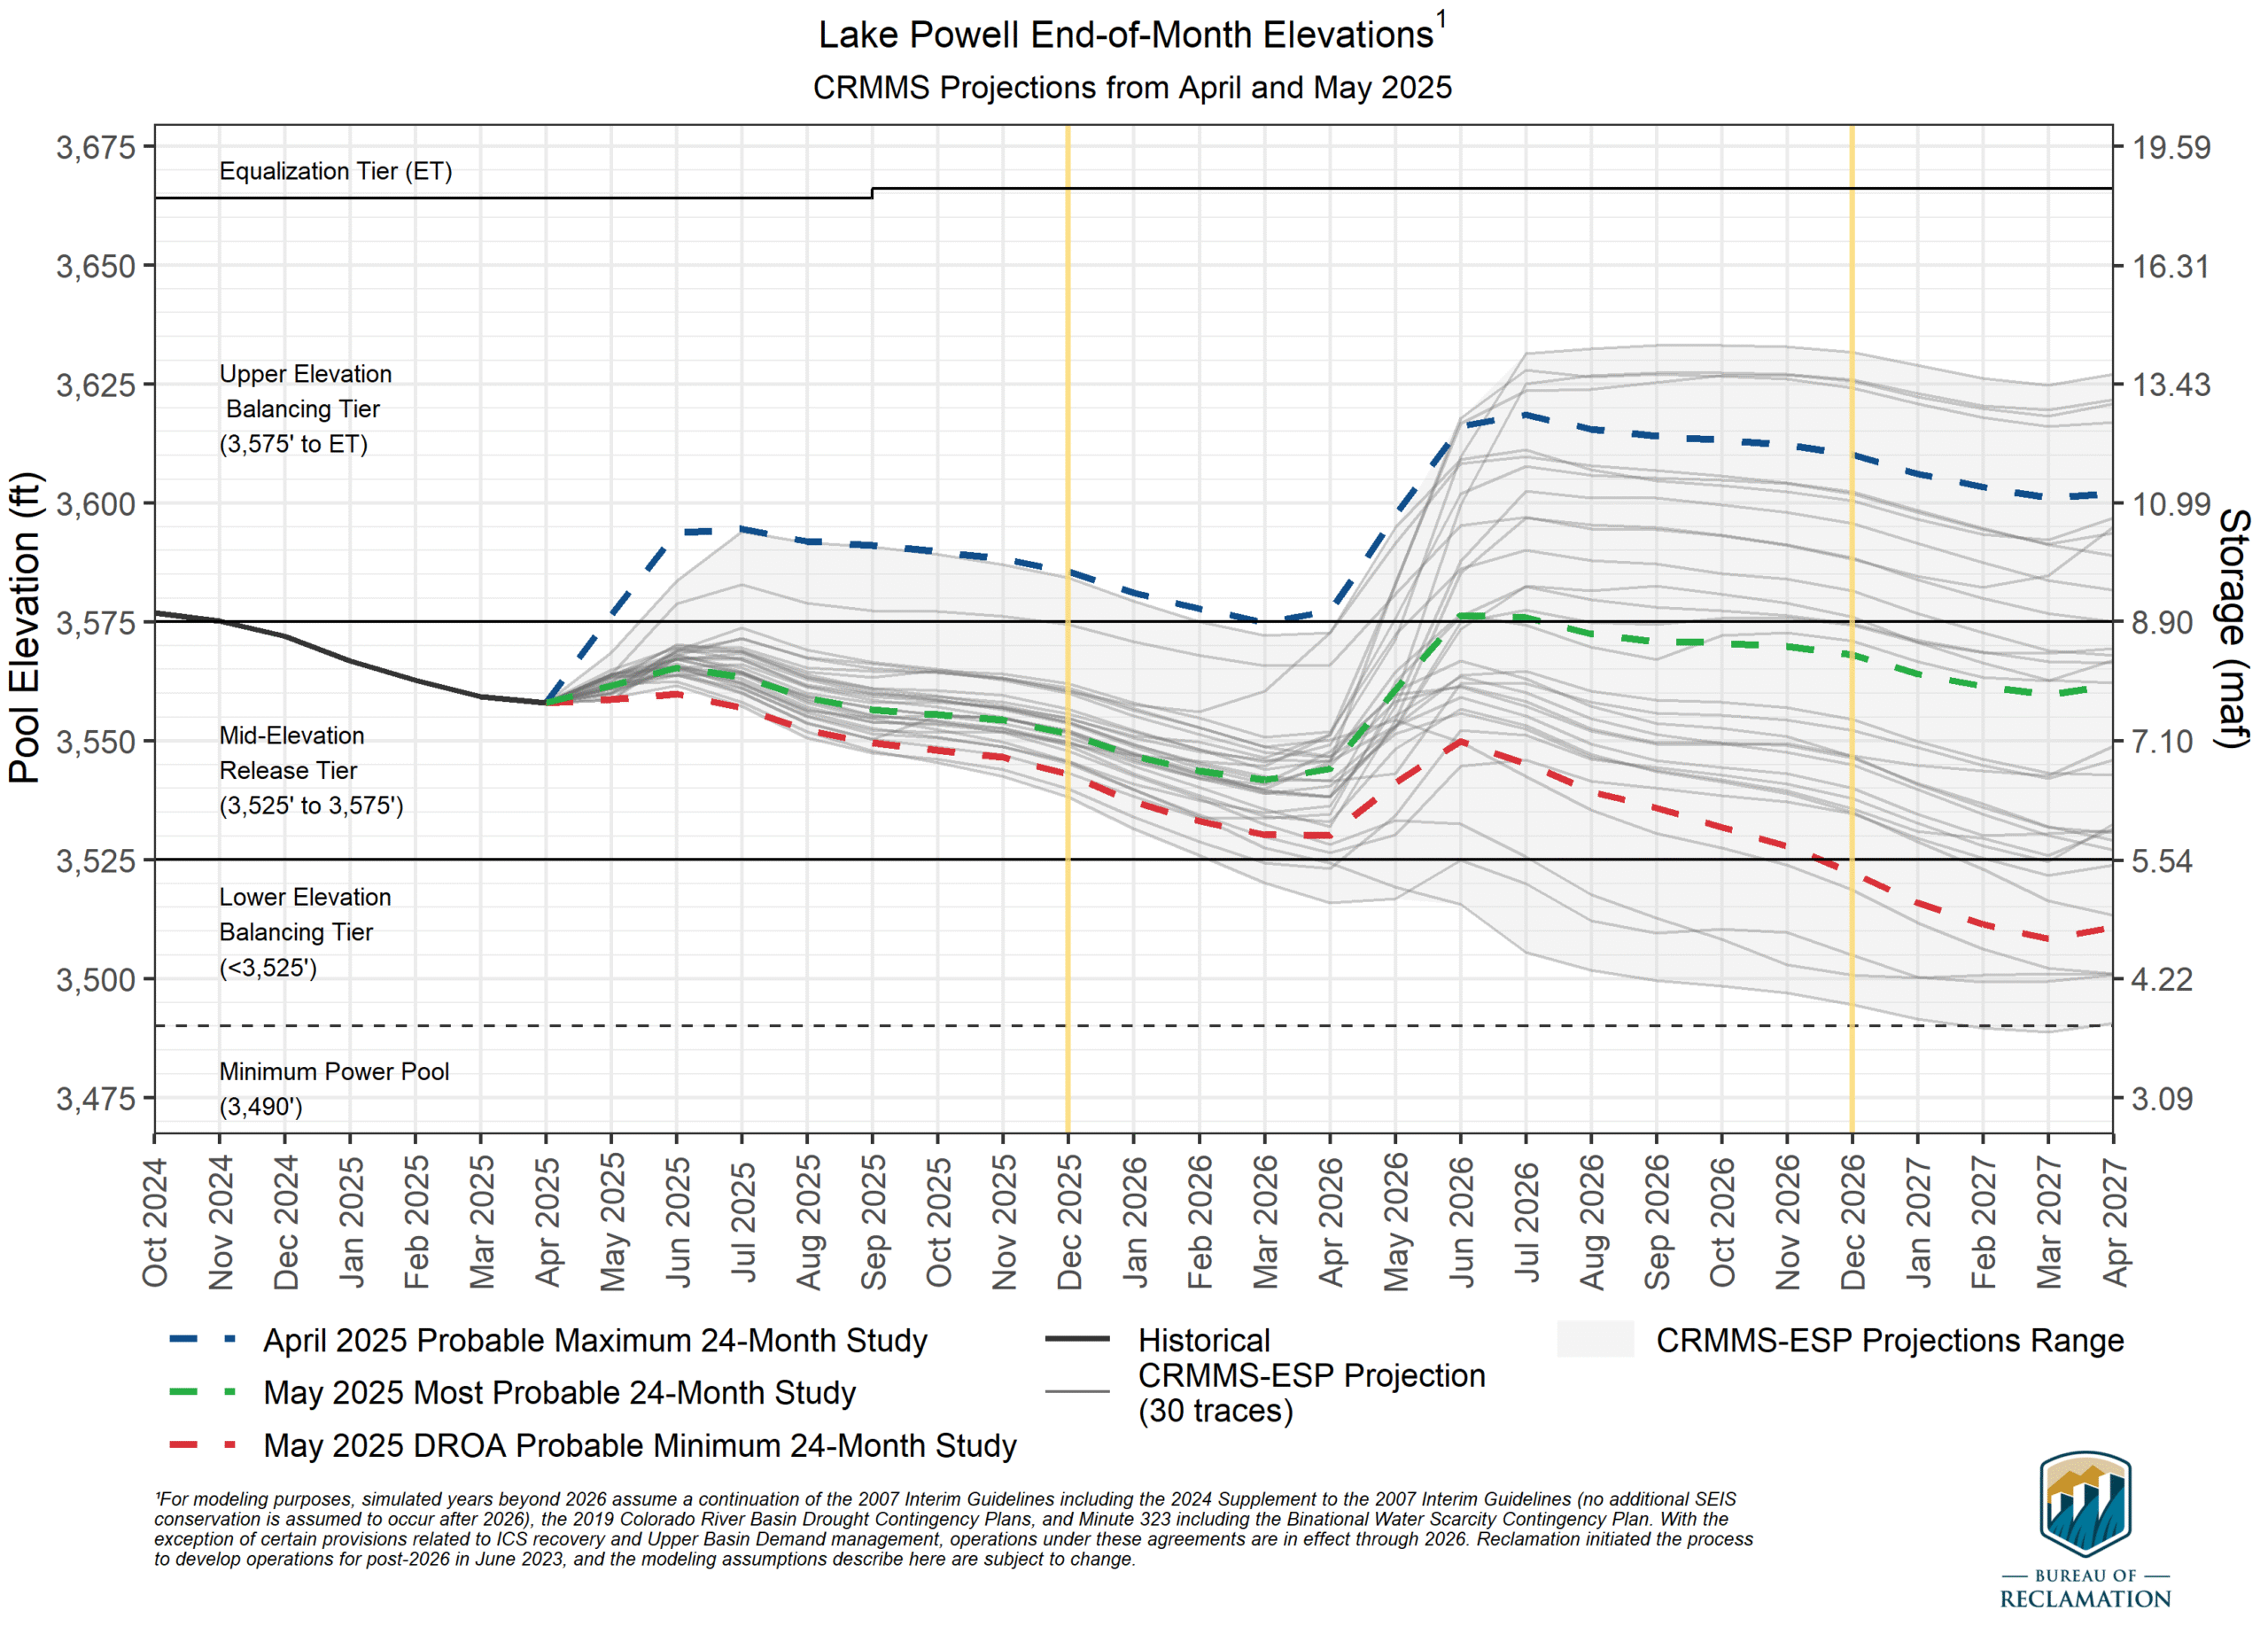
The Bureau of Reclamation has released its May 24-Month Study. It confirms that 2025 will be another very dry year and the consequences will be significant. Under the minimum probable forecast, active storage in Lake Powell will fall to an elevation of 3530’ (5.8 maf), only about 9 feet higher than the February 2023 low of 3521’ (5.3maf). Just as alarming, under the “most probable” scenario, 2027 is projected to be another year for a 7.48 maf release from Glen Canyon Dam. This means that the ten-year flows at Lee Ferry are projected to fall well below the 82.0 maf tripwire – the point at which the basin states’ disagreement over interpreting the Colorado River Compact’s Lee Ferry delivery/non-depletion requirement could trigger interstate litigation.
The May 1st “most probable” forecast for unregulated April to July inflow to Lake Powell was 3.5 maf, down from an April 1 st forecast of 4.3 maf. Since May 1st. However, the runoff forecast has continued to decline, down another ~400kaf as we write this (May 26, 2025). No one should be surprised if we end up with an actual inflow closer to the May 1st “minimum probable” forecast of 2.6 maf.
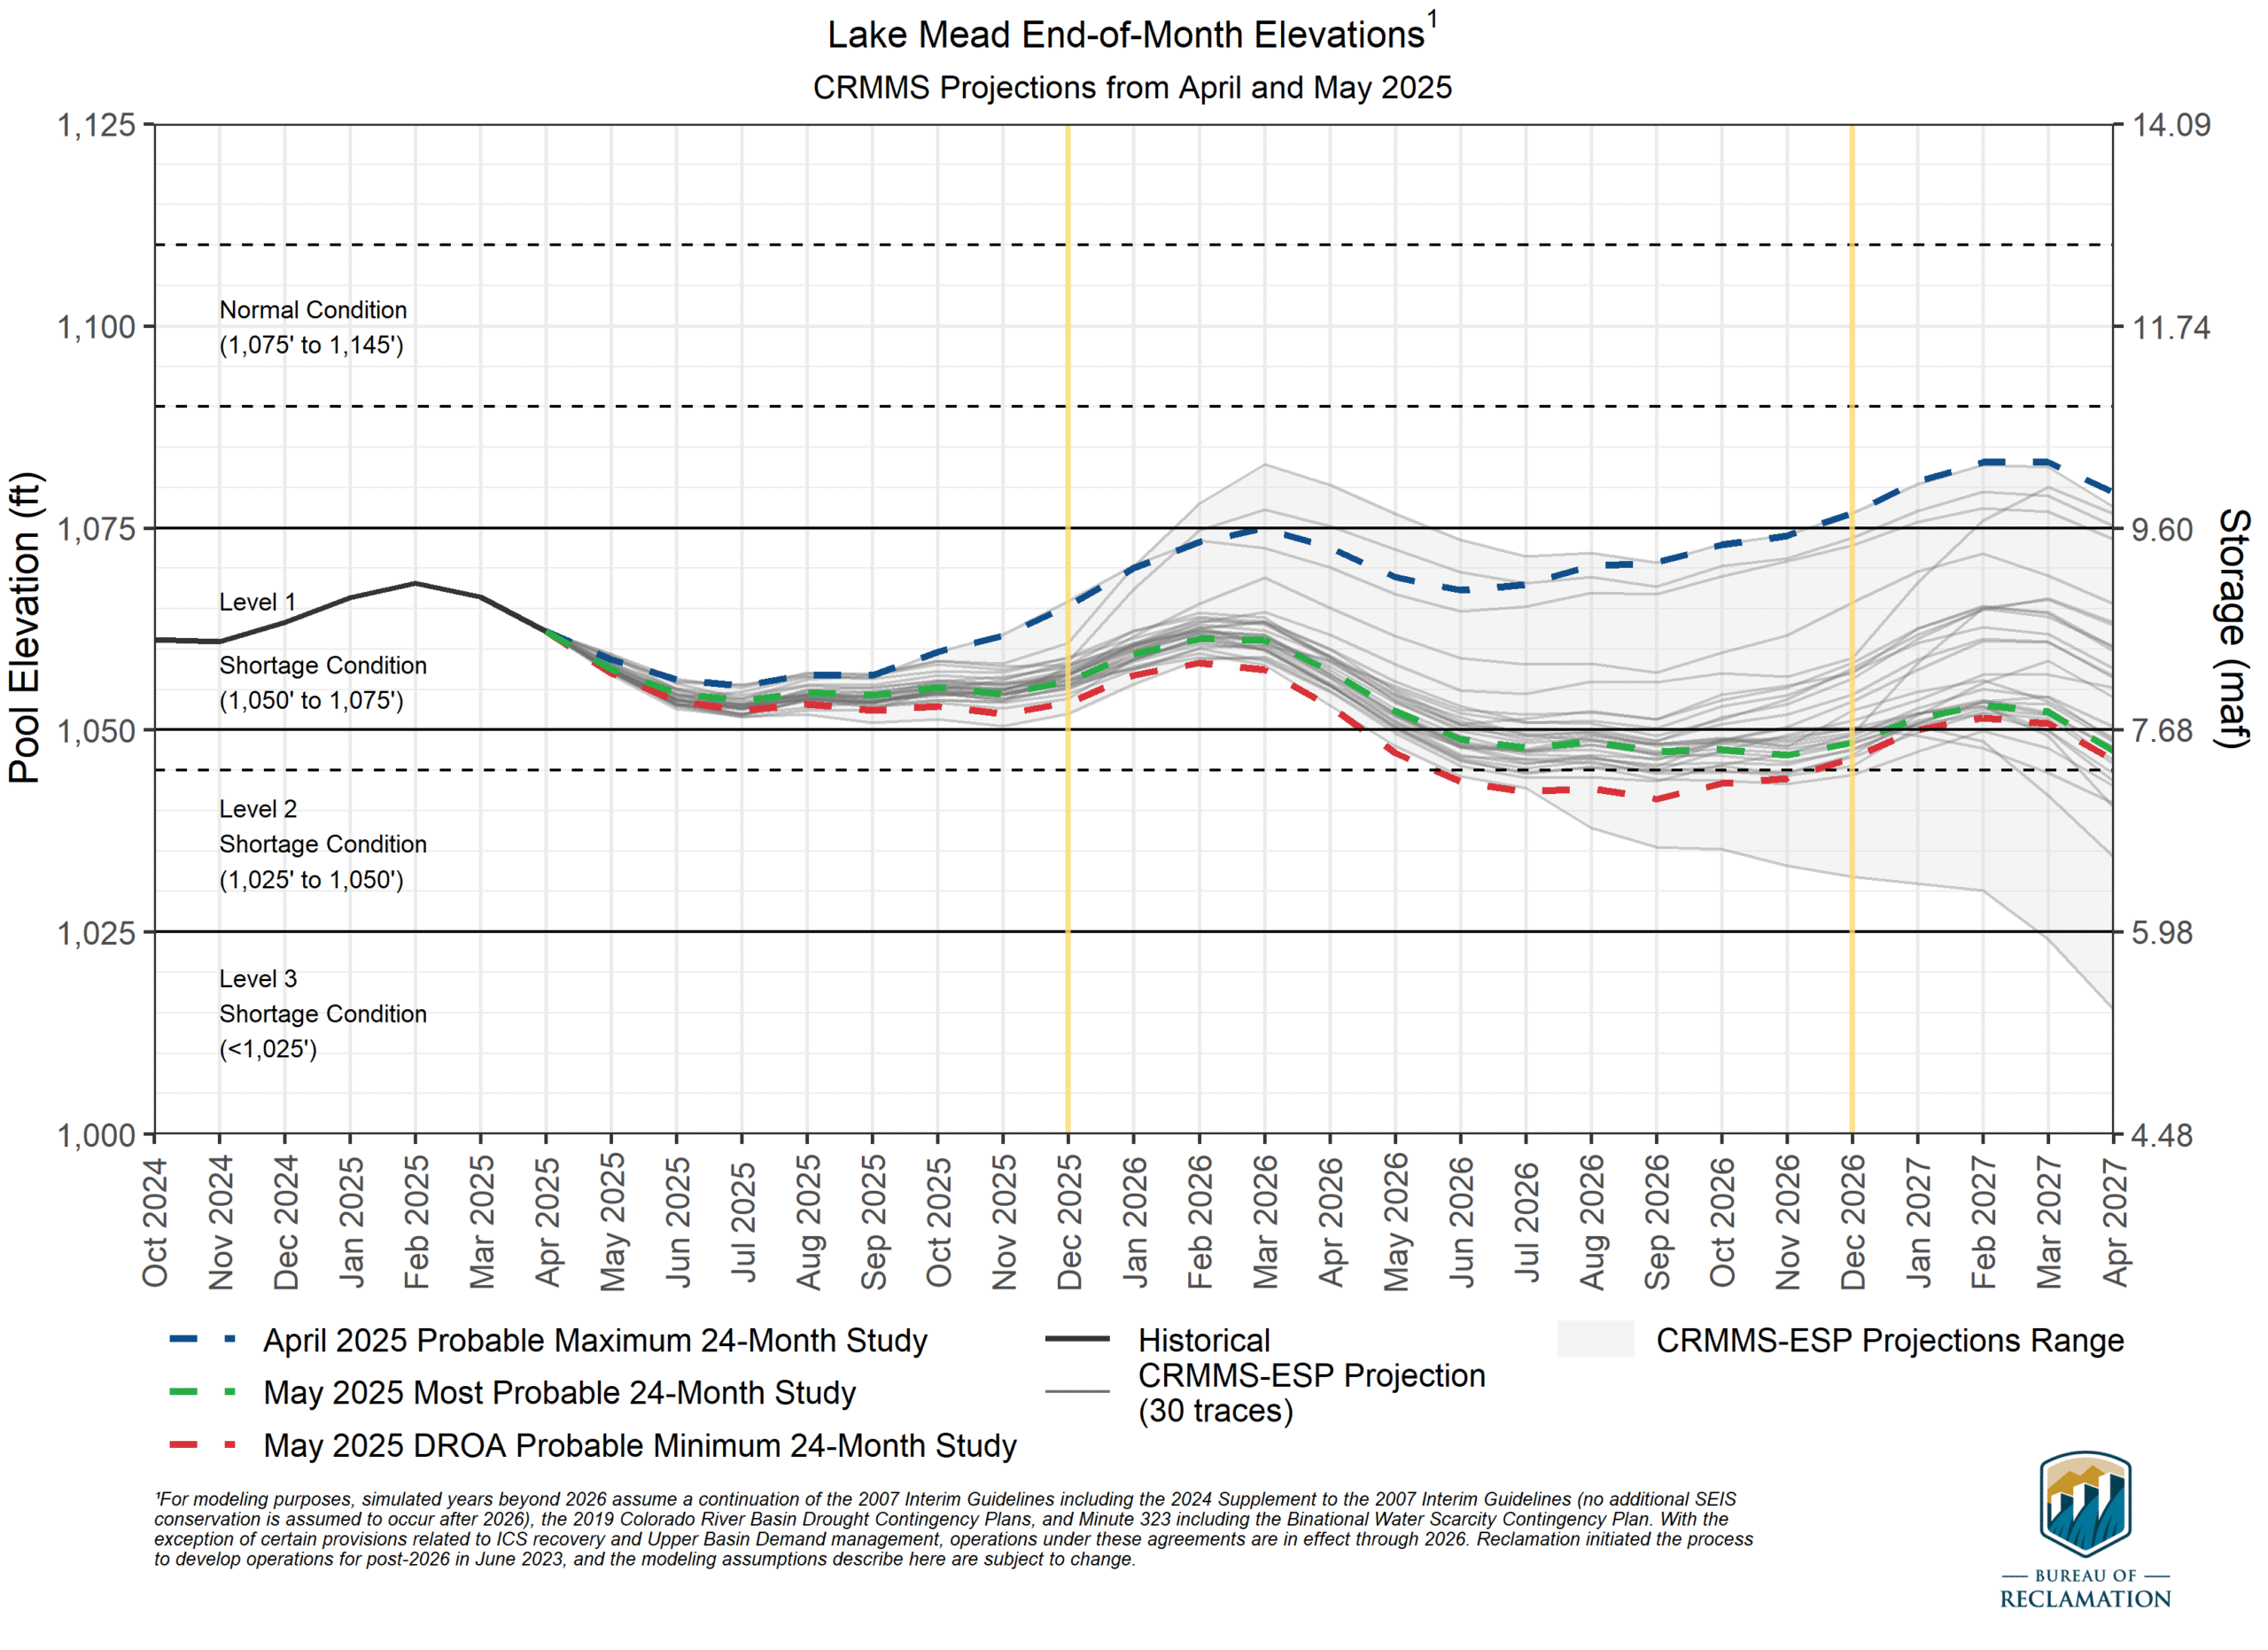
Even with continued crop fallowing programs, storage in Lake Mead also continues to decline, dropping to an elevation of 1047’ at the end of Water Year 2026 under the “most Probable” forecast and to elevation 1041’ under the “minimum probable” forecast.
cloudy forecast, part II
Lower Basin use continues to run well below long term averages, with this year’s consumptive use by Arizona, California, and Nevada forecast at 6.3maf, well below the legal paper water allocation of 7.5maf. Yet Mead keeps dropping. The latest analysis of total reservoir storage from our colleague and collaborator Jack Schmidt (here’s Jack and colleagues from March, with an update expected later this week) clearly shows that we are once again failing to rebuild reservoir storage. We’re draining the system.
Of course, the 2007 Interim Guidelines expire after 2026, so we do not know what the rules will be for Glen Canyon Dam releases in Water Year 2027. Lacking any better information, the Bureau of Reclamation has assumed a continuation of the 2007 Interim Guidelines rules. Another approach would be for the Bureau of Reclamation to assume that absent an agreement among the states, the Secretary of the Interior could return to an annual release of 8.23 maf from Glen Canyon as set by the 1970 Long-range Operating Criteria. And curiously, under the “minimum probable” scenario, assuming a continuation of the 2007 Interim Guidelines, the projected 2027 annual release at Glen Canyon Dam reverts to 8.23 maf. Under a quirk in the 2007 Interim Guidelines, if the December 31, 2026, projected elevation of Lake Powell is below 3525’ and the projected elevation of Lake Mead is below 1075,’ the release reverts to 8.23 maf. This was referred to as the “sacrifice Lake Powell to save Lake Mead” strategy (seriously!).
Unless the 2025-26 winter is very wet or the Basin States can find consensus, the choices facing the Basin are stark: sacrifice Lake Powell for Lake Mead and perhaps keep ten-year Lee Ferry flows above the tripwire (no guarantee) or reduce annual releases from Glen Canyon Dam to maintain a balanced but small amount of storage in both reservoirs, which risks pushing cumulative 10-year flows past Lee Ferry across the tripwire.
As casual (i.e., far from expert) reader, is the current lack/distortion of federal oversight an overall positive or negative in terms of interstate cooperation? Given very probable lack of a Truth Social post (i.e., White House “governance”) on the subject, is that better or worse in terms of coming to grips with this thing?
This is such a great question. A Truth Social post would likely be trouble, the lack of federal leadership/oversight is certainly a problem – no one to authoritatively referee the states’ bad behavior. But that is not unique to this administration, we didn’t see a strong federal role in latter years of the Biden administration, while in Trump 1, with Brenda Burman and David Bernhardt we song strong and productive federal leadership.
Here we go again. 6.3 MAF may be below their “legal paper water” allocation based on the (poor) language of AZ vs CA, but it most certainly is not below their allocation under any reasonable interpretation of the compact, which only provides for 7.5 MAF to ALL consumption by the LB states. We can’t ignore the evaporative losses which MUST be accounted for as LB use, one way or another. 6.3 plus 1.3-1.5 MAF of losses puts the LB (again) over their entitlement under the compact.
Saying the LB is only consuming 6.3 MAF and then “wondering” why Mead keep dropping is to obfuscate the issue.
Which reminds me of my favorite bumper sticker: Eschew Obfuscation.
Great report. lots of discussion RE: drop in reservoir levels, and aridity, evapo-transpiration, but does anyone have any updates on the Navajo-Gallup Water Supply Project? The project will extend a 300-mile-long water pipeline, construct two water treatment plants, build 19 pumping stations, and develop multiple water storage tanks. This project ensures that an estimated 250,000 people within the Eastern and Northern
Navajo Nation, the Jicarilla Apache Nation, and the City of Gallup will finally receive clean, reliable drinking water.
(from news release from Navajo-Gallup Water Supply Project Amendments Act of 2025)
I’ve seen various volumes of diversion from San Juan River below Navajo Dam, but how much and when?
Apparently no diversion yet, but imminent. This project needs to be added to the equation.
Well, what did Phoenix do? They built a massive semiconductor manufacturing plant which just opened. Which uses millions of gallons of water, according to research. So, really, the Lower Basin states can cut water in household and agricultural use, but industrial use might go up. It’s obvious the region is beyond its carrying capacity and has been for quite some time. They cling stubbornly to “we must have economic growth” and, hence, the solutions will be stubbornly opposed. Arizona will go to Trump and play the national security card with the semiconductor manufacturing if drastic water cuts are needed at Tier 2a. Which is on the way in the next few weeks.