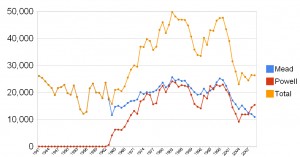
Total storage in Lake Mead at the end of September (the end of the western “water year”) was lower than it’s been since they first filled it in the 1940s. But this is a bit more complicated than that stark statement might appear.
If you click through to look at a larger version of the graph (numbers on the Y axis are thousands of acre feet of water), you’ll see that total storage in lakes Powell and Mead, the two huge rivers on the main stem of the Colorado River is pretty much the same this year as it was last year. Mead has been dropping while upstream, Lake Powell has been filling. In other words, what we’re seeing here on the short time scale of a single year is the result of a management decision, not a change in the overall supply of water available. It’s worth noting that the last time we saw something similar – Powell rising while Mead fell – was in 1964, after the completion of Glen Canyon Dam, when water was being held back to fill Powell for the first time.
I made the graph over the weekend from a couple of U.S. Bureau of Reclamation datasets because I’ve been having a hard time visualizing how the whole system works. Because of the legal and political distinctions between the Upper Basin and Lower Basin water management systems, much of the discussion involves separate conversations about one of the lakes or the other, not both taken together. And FYI, this is just a quickie analysis, I haven’t done any quality control on the data, so this is not publication quality information.
Oh wait. I guess I just published it, didn’t I?


Pingback: uberVU - social comments
What hits one in the face is that during the previous 3 decades the average acre-feet was around 40,000 and this decade it is hovering around 27,000 (at a rough estimate.)
Very cool! I’ll blog this (esp. the governance thing…)
Pingback: Tweets that mention jfleck at inkstain » Storage In Mead and Powell -- Topsy.com
John,
To complete your analysis about the lake levels and the relationships – use Google. The terms “mead powell equalization” points you in the correct direction. Another search containing “colorado river aop” is another good lead.
After your investigations on Google and perusing several documents found by your search, I think that it may make more sense to you or give you more questions to ask.
dg
Terry Fulp, an USBR mathematician, super smart and thoroughly decent guy, could also help you. You could reach him through the Lower Basin office. He understands the numbers and the reservoir balancing agreement struck in 2007 — link here: http://www.usbr.gov/lc/region/programs/strategies/RecordofDecision.pdf
Glad you’ve got the ball rolling discussing reservoir management and sorry for the lateness in spotting it.
Twitter fries my mind, so I have to wait until I get around to perusing my favorite newspapers and websites to see what’s up.
-EG
Pingback: The Problem of Boundaries | 1800blogger
Pingback: jfleck at inkstain » A Clarification on the Mead-Powell Data
Pingback: jfleck at inkstain » Could Global Warming Be Good for Colorado River Flows?
Pingback: How Low Can Mead Go? Let’s Talk Come June : jfleck at inkstain