
With little water storage to speak of in the Imperial Valley, the flow of the All-American Canal west from Imperial Dam integrates, in close to real time, the collective decisions of a thousand farmers growing crops on half a million acres.
A “hydrograph” is a commonly used tool for looking at the flow of water past a measurement gauge over time. You put time on the “x” axis and flow on the “y” axis, to help visualize its ups and downs. There aren’t many natural hydrographs left to look at in the western United States, but I’m fascinated with human-intermediated ones.
I’ve written before about the “institutional hydrograph” on my Rio Grande, where we have an annual bump in flow as water is moved to meet end-of-year compact delivery obligations. On the All-American Canal, you can see – what – an “agronomic hydrograph”?
All-American Canal flows
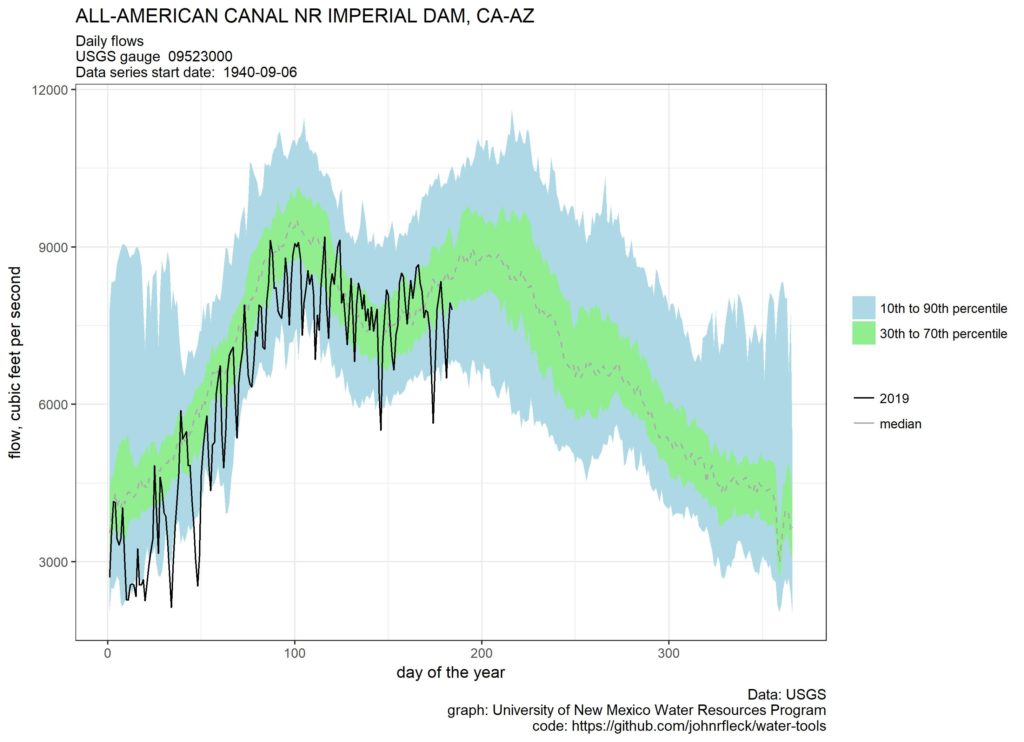
I spent my holiday afternoon cleaning up some data visualization code I use to help me think about USGS gauge data. (On github here.) One of the gauges I tried it out on was the flow down the All-American Canal from Imperial Dam. The double peak is fascinating – heaviest water use in April, then a drop, then another peak in late July and early August.
It’s an agronomic hydrograph, driven in part by cropping patterns (the Imperial Irrigation District publishes wonderful data here summing up the collective behavior of the valley’s farmers) and partly the weather. August, I’m told, is really hot down there.
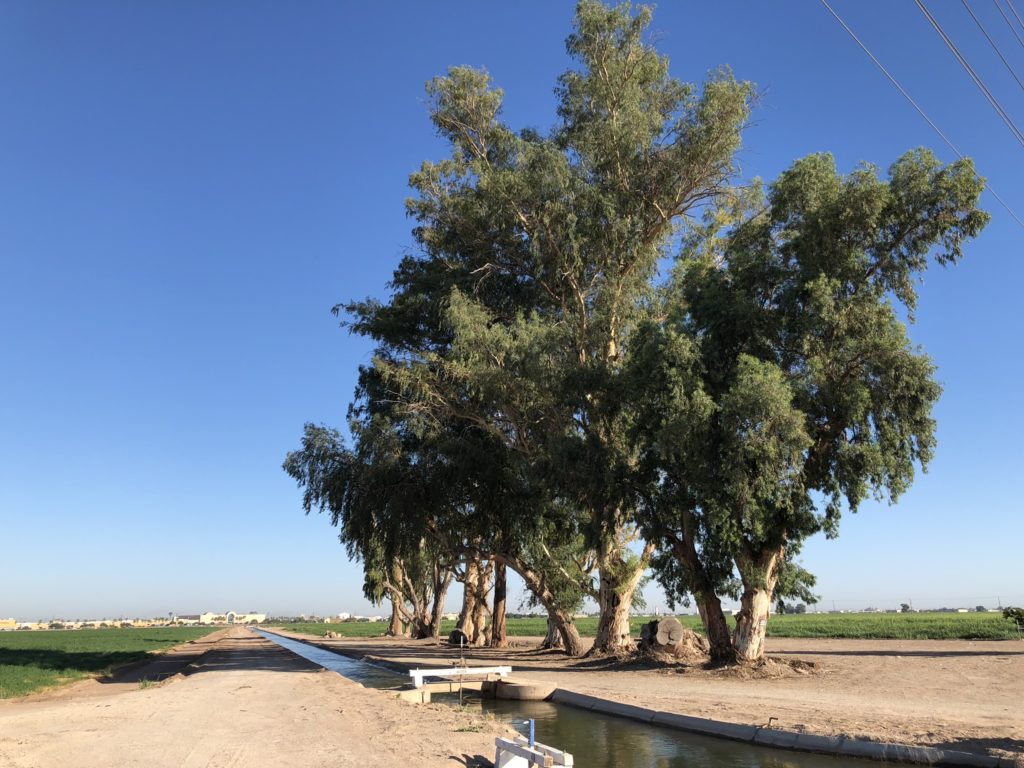
Farming the desert. El Centro, California, June 2019, by John Fleck
A worthy task trying to unravel this. You’ll have to drill down on the Yuma water users, IID and Coachella irrigation districts as they all draw off the AAC canal. Factor in crops in these areas and you should gain some insights into where the water went during the timeframe.
This could be a great exercise for your students to trace out. The cheat sheet is a call to water operations in Boulder City and ask for the water usage from the irrigation districts.?
Data should be both taken from both the source and destinations to connect the dots.
Right! I forgot about the other users getting water out of the AAC. Also Bard, and isn’t a portion of Mexico’s water routed through the AAC and then dropped down to Morelos Dam via the Pilot Knob power plant?
Yes the Northerly International delivery is through the All American canal then diverted through the Pilot Knob generating station back to the Colorado River just south or at Cocopah Bend. Thence south to Morales Dam. If Gila is flowing or flood control releases from Imperial then delivery to Mexico is made directly in the Colorado River and not through Pilot Knob. Dave we should get John a copy of the Blue Dragon?
In addition to Dave’s suggestion is what we tried to do which is determine what is being planted when and at what farm…and what is the water demand. This was necessary to quantify uncertainty in our overall forecasted operations such as anticipated demand at Parker Dam. IID’s water control center in Imperial is the nerve center for Imperial deliveries like Boulder Canyon is for the Lower Colorado. Here’s the rub: what farmers are planting are based on global economics, which in turn drives water demand. Unless you have a workable, flexible, global agricultural economic model that can reasonably predict supply and demand in terms of cropping patterns, you will be limited in ability to forecast changes to delivery patterns. A while back winter wheat was being planted which increased demand earlier in the season at Parker. At the time Parker had one unit out for maintenance and the other three were full bore because of winter wheat demand.
Takeaway: reschedule the maintenance.
@Doug: The Blue Dragon. I think that John might have that schematic. Seems that a government official got rid of one sometime back in 2018 when he was walking out the door. This particular Blue Dragon had been given to him back in the ‘90s and had been posted at his desk for the duration. You know the story here. The old one got passed on and a new one was given to the old guy as he went out the door. Everyone of importance had signed it to remind him that he too did a small part in the mission. I believe even you had signed it too…
Looking back on it, the Blue Dragon defined our mission as well as any statement.
This kind of musing gets to the heart of how operations work; I love it. Another perspective would be to map remote sensed ET (using a method such as METRIC or OpenET) for the places of use served by the canal. This would provide a spatial view of AF/acre.
Well, the “gorilla in the room” that I see is that the 2019 flows are well below average, maybe
only 10% of historic. What gives? We know that California had a wet year and most reservoirs
are full. Of course, this water is Colorado River water. But there again, the watersheds saw a
really wet year, and Lake Mead has not hit the low water trigger yet. So, what gives? 2019 looks
like a really really dry year on this canal.
Further, why the extraordinary dips in flow … from 50th percentile to below 10th percentile
and then back again so many times this year. Does the canal really go slack, then full, then
slack, then full again in such a cyclic way? It is almost as if all the farmers wanted to water on
the first and 15th of every month, and not inbetween, and all on the same schedule. Is that
the actual way the canal works?