
For grins, an analysis of web traffic over the last 11 months on Inkstain:
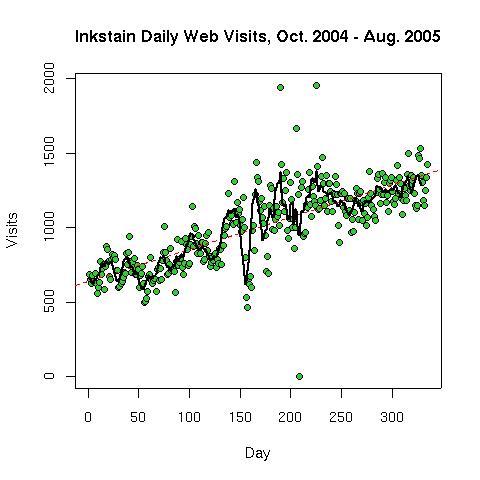
Green dots are daily “visits,” as defined by Webalizer‘s default – essentially all requests from the same IP address separated by less than 30 minutes count as a single “visit.” (This means that people poking Inkstain for its RSS feed more frequently than every 30 minutes, like p.g.o does, show up as a small number of visits despite accounting for a large number of hits.)
The black line is a 7-day rolling average, and the red dotted line is a simple linear regression – not really statistically meaningful, but hey – this is a blog, not science!
I’m looking for some reasonable way of sorting out how many of the hits/visits are coming from bots. If one assumes they’re well-behaved and are therefore asking for “robots.txt,” then they account for something like 10 percent at most. But I’ve got to think it’s substantially higher than that.
I am happy to report that “Mozilla/5.0 (X11; U; Linux i686; en-US; rv:1.7.10) Gecko/2005” is the most common browser here, suggesting that despite my increasingly tenuous connection to the free software world as anything other than a user, the prototypical Inkstain readers are still geeks with too much time on their hands. And that perennial favorite, “Google games,” remains the most common search string by which people find their way here.
(Stats done with R.)