
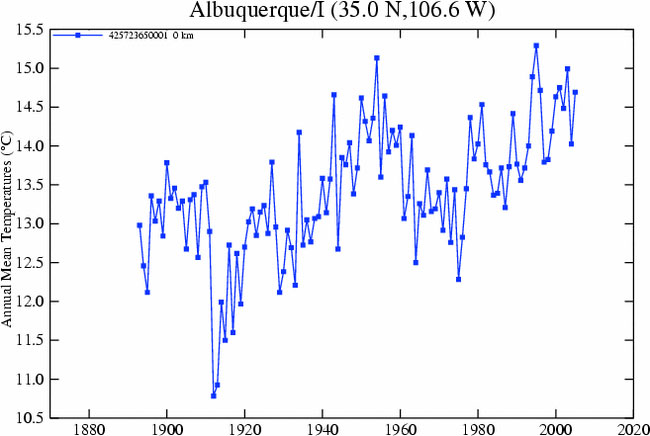
It occurs to me that if I really believe that the regional-scale climate change question is relevant, I should offer up the Albuquerque temperature numbers. 2005, according to the GISS data (adjusted to try to remove an urban bias), is the seventh warmest in history. Seven of the ten warmest years here have come since 1995 1994:
The 10 warmest years in Albuquerque:
- 1995
- 1954
- 2003
- 1994
- 2001
- 1996
- 2005
- 1943
- 1956
- 2000
(It’s a fun game! Click on the map where you live to hunt for local warming!)
Hmmm –
I was intrigued by your statement “adjusted to try to remove an urban bias” – with emphasis on the word “try”. After looking in vain for some published numbers concerning the actual “Urban Heat Island” adjustments, I decided to take a little look at the area around Albuquerque.
I checked the “rural” sites closer than 200 km on the link, and found that not only was the average trend only *one third* of what Albuquerque’s was, but the further one went from Albuquerque, the less the heating was. Albuquerque is shown as 1.5 deg C per century, but the average nearby rural temperature trends only to 0.5 deg C per century, and decreases with distance so that at 200 km the trend is only 0.3 deg C/100 yrs.
So, I have to agree with you, that they are only “trying” to correct for the Urban Heat Island effect. Also, Science magazine has lately been emphasizing land use and albedo changes, which are now noted as “significant”. China’s particulate pollution is darkening up the Arctic snow and ice – which is making it melt faster. What are your thoughts on that?
Pingback: jfleck at inkstain » Blog Archive » Black Carbon on Snow
entire Busting keys Balls again