
Everybody’s yammering about the warm January in the U.S., with the entire country seeing positive temperature anomalies (hat tip Mike Mann for graphic and discussion of global climate change implications of all this)

If you look at the map linked above, you’ll see that Albuquerque, at 3.8 degrees F above average, is in a region that saw smaller anomalies than most of the nation. We tied for 14th in National Weather Service records going back to the 1880s. Seven of the warmer Januarys have come since 1990.
The map of January precip anomalies looks a bit different, but downright dire here. No single month matters completely, but a look at the 90-day map should be enough to startle you:
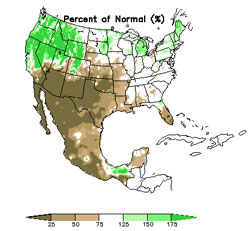
(Source: Climate Prediction Center, NOAA)
Expect more of the same. The CPC announced yesterday that we’ve officially crossed the La Niña threshold as a result of cooling in the equatorial Pacific. La Niña, which has really been lurking in the wings for a while, tips the odds toward the sort of map you see above – dry across the southern US and Mexico.