
As winter progresses, snowpack is one of the key western U.S. drought variables to monitor. Snowpack is an important leading indicator of hydrologic drought (see here for a discussion of various drought definitions and measures) in the coming year. Snow that builds up in the mountains during the winter season becomes a sort of storage reservoir for summer irrigation and water supply.
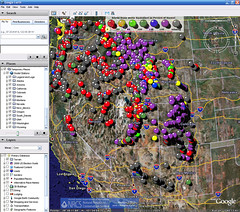
Tom Pagano at the Natural Resources Conservation Service in Portland, Ore., has spent a lot of time developing useful tools for monitoring snowpack. Last year, he developed a terrific Google Earth tool that provides a window into the NRCS Snotel data. The Snotel stations are telemetered, automated weather and snowpack condition monitoring sites – how much snow has just fallen, how much is on the ground there now, etc. You can pull back and get a good region-wide idea of what’s going in, or zoom in to the particular mountain range of interest to you.
It’s too early in the season for this data to be very meaningful, but by December or January the Snotel data is worth watching. And it’s fun to watch even now.
Developing tools people can use via Google Earth to assess environmental measurements is an interesting idea.
As a streamflow forecaster, Tom Pagano is particularly interested in this: how to take the data he’s got and make it the most useful to end users. I’m not sure Google Earth is the answer. I’ll have a better feel after being Tom’s end user for a winter season with this new tool. 🙂 But it looks like it has the potential to work better than the other snowpack monitoring tools that I have previously used.
One interesting potential is the idea of “Google Earth mashups” – you can look at the snowpack data, then overlay the VIC model output, then look at the weather radar. Well, I guess that’s it, those are the only three I know of. But the idea that you can overlay different people’s files on the same window expands its usefulness.