
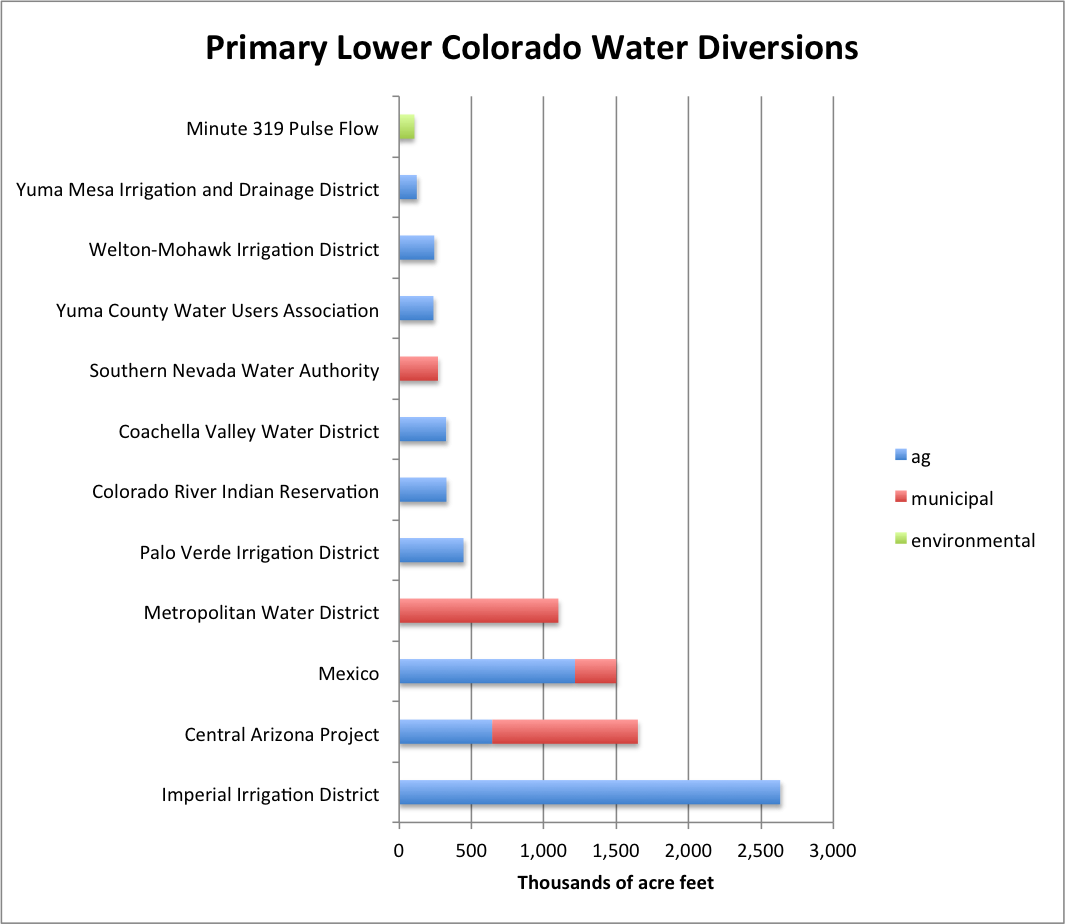
A couple of weeks back, I made a quickie bar graph to provide some context for the amount of water involved in the Colorado River Delta pulse flow. It was half-assed. A reader asked for more: “Would love it more if it included other things, like Las Vegas consumption, MWD consumption, UB pasture irrigation, and so on…. Nothing like a bar graph to put things in perspective.”
In response, today we launch a new feature here on Inkstain: Ask Me A Colorado River Question.
The main point here is that the environmental pulse flow, as significant as it is, involves a relatively small amount of water.
Lower Colorado Diversions
As you can see, I didn’t go quite as far as my reader asked. This is only Lower Colorado River Basin diversions – Lake Mead on down. Other notes on the data:
- It’s only diversions greater than 100,000 acre feet. That captures 97 percent of the water use, and made typing in data a lot easer.
- 100,000 acre feet ~ 123 million cubic meters in the rest of the world, apologies for our wacky US water measures
- For the Central Arizona Project, I estimated the ag-urban split based on data here and the presumption that all the Indian water was M&I. That’s probably wrong, so the ag-urban split is probably wrong, but the overall bar size is what matters.
- For the Mexico numbers, I presumed 81 percent of the water diverted is agricultural, which is a commonly used number, but I haven’t chased down its origin yet.
- The numbers came from the USBR’s 2013 consumptive use report (pdf here)
- My spreadsheet with the numbers is here
I love it!
Both Mexico and CAP – AZ have the same split on AG vs Urban water uses. Its 80%.
Mark
Pingback: Another Week of Climate Disruption News, April 20, 2014 – A Few Things Ill Considered
Pingback: Another Week of Climate Disruption News, April 20, 2014 [A Few Things Ill Considered] | Gaia Gazette