
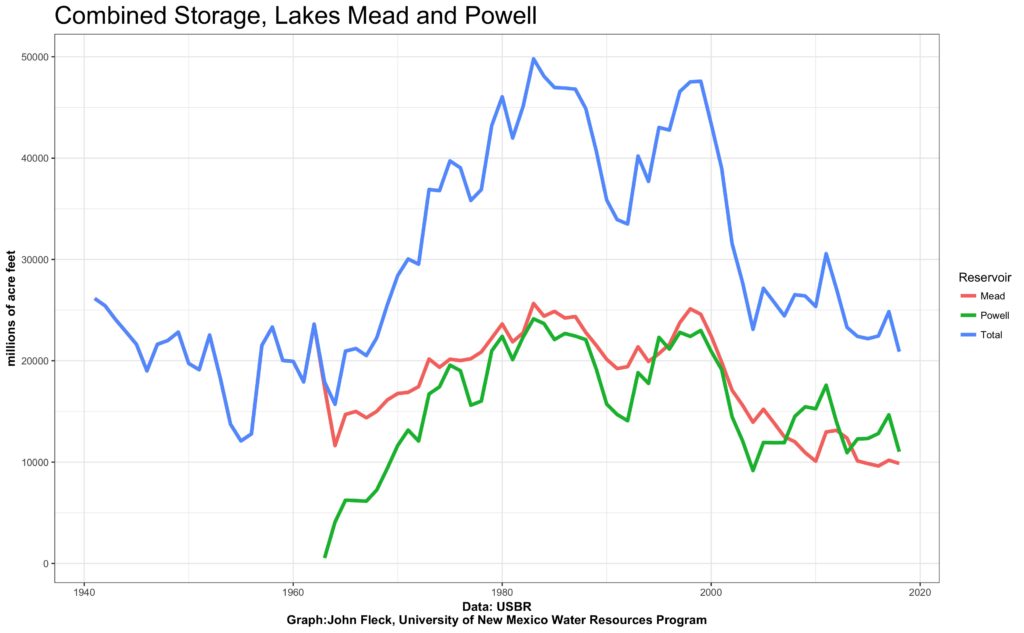
Storage in lakes Mead and Powell
In the years I’ve been working on Colorado River stuff, I’ve collected a lot of data. Most of this is stuff the river managers at the Bureau of Reclamation have generously shared with me. Some I’ve assembled myself by transcribing old paper/pdf records of historic documents. Some of the Bureau’s most important data is already easily publicly available (most notably the Natural Flow Database, Lake Mead elevation, Upper Basin reservoir elevation and storage histories, and the 24-month studies). But over the years, the accumulation on my hard drive(s) has turned into a useful personal resource for my research and writing if I wanna look up, say, what the trends are in water use in Yuma or some such.
I’ve been meaning for a while to find a way to make what I’ve got more accessible. So I’ve started uploading data to Github. First up is the data for the graph above, for which I get a lot of requests. It’s total end-of-water-year storage in Lake Mead and Lake Powell, stitched together in a more easily usable form from a couple of different USBR datasets. I update my personal copy sorta monthly with the Bureau’s forecasts and make scary graphs to post on Twitter. (Scary Lake Mead graphs make great clickbait.) The stuff on Github is just actual year end numbers.
Two motivations: I’m teaching a Colorado River-related course this spring at the University of New Mexico Water Resources Program – we’ll need data! And as Eric Kuhn and I finish up the new book, we’re starting to think about how to make the key data and documents used in the book easily available. Not sure this is the platform, but this’ll give me an experimental toy to think about how to do it.
It’s interesting that the BuRec still has funding for their web site while so many Fed sites have gone dark.
USBR fully funded I learned yesterday. Critical mission and national security concerns wrt dams; water and power… I am heading over to the UNM water resources website to find out more info on the CO River class. sounds ideal.
how about all of the upstream reservoirs too?
it seems at times they hold water back and other times they don’t…
Thanks a ton for doing this, John — very useful!
For my part, I’ve been working with a team of much-smarter-than-me researchers that have been documenting monthly flow depletions in every river and stream across the US, attributing the flow depletion in each stream to specific water-use sectors AND EVERY INDIVIDUAL CROP, estimating how many fish species have been extirpated by the flow depletions, and then documenting where those crops end up getting consumed. For instance, we’re about to submit a paper to Nature (titled “Is My Burger Killing a River?”) that documents which cities and countries are most responsible for river depletions and fish imperilment in the Colorado, or the Rio Grande, or the Sacramento, etc due to their consumption of burgers (and steaks). I’m hoping my colleagues will make these data available publicly once we’ve published. Stay tuned!