
Eric Kuhn’s been calling this a “sneaky drought”:
Another forecast predicting a dry warm spring for the Colorado River basin – The official CRBFC May runoff forecasts will be out next week. Look for a big drop in the A-J unregulated inflow to Lake Powell. https://t.co/5GkozLVHim
— Richard Eric Kuhn (@R_EricKuhn) May 1, 2020
It’s been particularly sneaky in part because the forecast seemed OK back in March, and then we all got distracted by a global pandemic and the collapse of our economy. While our eyes were averted from mundane things like how much snow there was in the mountains and how much we could expect to melt and flow into our rivers, the forecast has been tanking. I honestly hadn’t been paying close attention.
The official forecast won’t be out until early next week, but the preliminary numbers suggest inflow into Lake Powell, the upper of the Colorado River’s two primary storage reservoirs, will be a million acre feet less than we thought it would be a month ago. “We’re talking about 4.5maf,” Eric said when he and I were talking this afternoon. “That’s low. That’s ugly.”
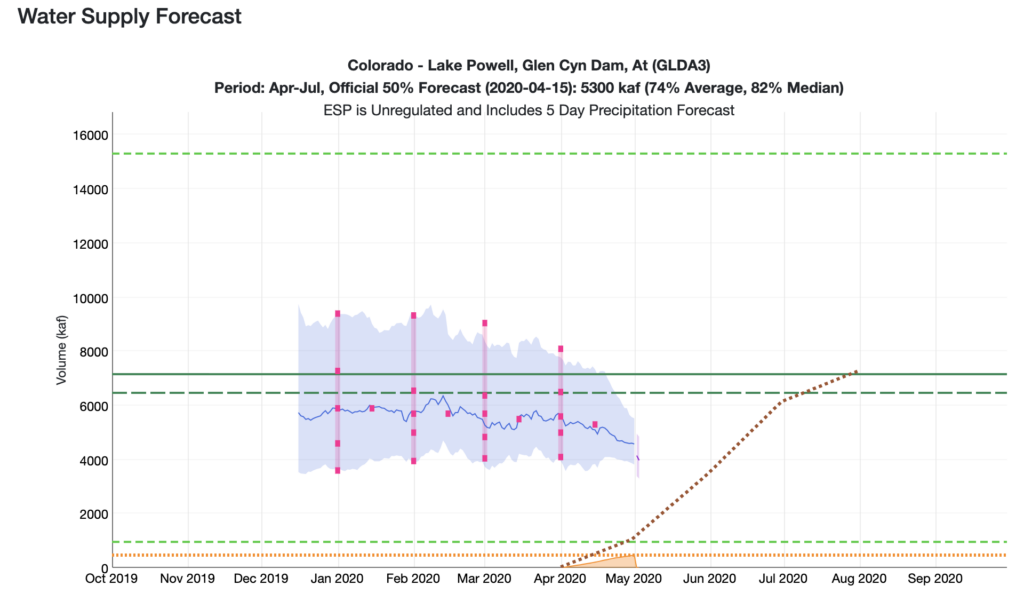
Courtesy Colorado Basin River Forecast Center
An April-July inflow of 4.6 million acre feet, which is what the preliminary modeling suggests, would be just 58 percent of the long term mean.
Courtesy Colorado Basin River Forecast Center
It’s been a particularly vicious year in the southern Rockies, which feed the San Juan River.
Huge thanks the crew at NOAA’s Colorado Basin River Forecast Center, who do a great job of forecasting, and also a phenomenal job of communicating that forecast information. They’re having a webinar Thursday at 10 a.m. MT if you’d like to distract yourself from all the epidemiological bad news with some hydrologic bad news.
Thoughts on possible influence of no snow in mid-country (<8500 feet), versus good high snow where the snotel system is? Obviously soil moisture is a huge player, but SW Colorado did not see much snow in the mid elevations this year. Wondering how much that may be influencing runoff?
John (and Eric), I’ve been noticing that the recent month-to-month forecasts have been consistently over-estimating runoff for the past few months. Seems like the forecasting models are not adequately accounting for antecedent soil moisture, or increased evaporation and snowpack sublimation under warmer temperatures. This is what motivated me to write my recent blog about “Day Zero for the Colorado River.” From 2000-2004 we went from full reservoirs to half-full; another 5-year sequence of low inflows similar to that one would completely deplete Lake Mead and Lake Powell, and that multi-year dry sequence started with a year in which Powell inflows were 71% of average (as compared to 58% projected for this year). I don’t want to sound like Cassandra, but we are woefully unprepared for a repeat of 2000-2004 and we need to start moving fast on demand management. https://www.sustainablewaters.org/day-zero-for-the-colorado-river/
Brian – Thanks, yes, that’s consistent with the argument Anne Castle and I made last fall – https://papers.ssrn.com/sol3/papers.cfm?abstract_id=3483654 . See figure 7 based on the Bureau’s “what if we have a 2000-2004 repeat” analysis and John Carron’s similar analysis done for the River District’s risk study.
Actually, John, the Bureau’s graph (your Figure 7) does not show what I’m saying. I’m saying that Lake Powell could literally drop to elevation 3370′ with a repeat of 2000-2004 hydrology — meaning it would be DRY. Figure 7 is quite misleading because it only shows lake levels dropping below the point where hydropower production ceases (3490 feet). I think that the Bureau’s modeling is assuming that some magical demand management program would immediately kick in and save the reservoirs from going dry, which I do not believe is honest nor realistic because there is no definitive plan in place to implement demand management at the necessary speed. I think that if we were being more honest with our audiences, e.g., “America’s two largest reservoirs could run out of water in just five years,” maybe we’d be grabbing their attention and spurring more rapid and concerted action?
Brian – I’m intrigued by the differences between your model, the Bureau’s, and John Carron’s. One of our concerns (reflected in comments we submitted to the 7.D Interim Guidelines review) is that the Bureau’s model, because of how it models Upper Basin demand schedules, may actually be *overstating* UB demands. It would be interesting to cause a conversation between you and the folks at Jack Schmidt’s Utah State group, who are doing their own independent analysis of the modeling to, among other things, try to disentangle the problems of Upper Basin demands in the models.
Just to be perfectly clear: IF (1) the natural runoff from the Upper Basin is equal to what we say in 2000-2004 (avg. 9.5/year), and (2) the Upper Basin uses the same amount of water as it did during 2000-2004 (avg 3.6 MAF/year); and (3) the Bureau releases the same volume of water from Lake Powell as it did during those years (8.2 MAF/year) THEN Lake Powell goes completely dry. No model, just very simple math. Five years at a loss of 2.3 MAF/year from Lake Powell equals dry reservoir!
SW Colorado has been pounded by sustained 10-15 MPH winds at lower elevations, probably worse where the snowpack is for the last month or more. Forecasts need to do better accounting for wind driven sublimation. More Snow fences would be a way to mitigate some of it, per Hibbert, but they are fairly expensive and naturalists hate them:
https://www.fs.usda.gov/rmrs/publications/managing-vegetation-increase-flow-colorado-river-basin
Storms have also been tracking south of Colorado. Last I heard Arizona Gila, Salt and Verde reservoirs are brim full as a result, so the could take voluntary reductions and take some pressure off Mead and Powell as Hasenkamp suggested at the Scottsdale conference.
Storm track moving around is a long running fact of life in the Southwest.
If you’re concerned about higher temperatures and soil moisture you should be equally concerned with forests that are too dense in an arid basin. I watered trees a couple weeks ago, they had sucked every drop of water that was left out of the soil and will take most of the runoff especially high elevation spruce and fir where the snowpack is. Hibbert again:
http://coweeta.uga.edu/publications/842.pdf
Increasing Forest Density is probably a key factor in reduced flows as temperatures rise. Reducing forest density would mitigate the effects. The Udall Overpeck paper didn’t account for it, Brad agreed with me someone should study it.
Brian –
Thanks for that explanation. I see two differences between your model and my own similar model (we’re building models in the spring class I’m teaching), one which doesn’t matter, and one which does.
1) Your model assumes Powell inflows equals your natural runoff minus upper basin uses, which nets 5.9 maf inflow into Powell. I’m using actual measured inflows into Powell during 2000-04, which averaged ~6.178 maf, minus calculated evaporation. I end up also at ~5.9 maf, so we’re using independent methods to come up with a number that matches. Yay!
2) Your model assumes 8.23 maf releases. My model assumes the current operating rules, which would drop those releases to 7.5 maf, probably, in 2023.
My model comes reasonably close to the Bureau’s graph – I think “2” may explain the differences. It’s reasonable to ask which set of assumptions is more useful in estimating the risk, but I think both models support your basic point – we’re not ready for a repeat of the 2000-04 drought even under my more optimistic model.
Brian and John, just saw this post, hope you both are well. The one problem with the “simple math” approach is that 2000-2004 was before the 07 Guidelines took effect, so the system was still being operated under LROC rules. If that drought repeated, under current operating rules, releases may actually drop all the way to 7.0 maf, but would certainly be less than 8.23. That still may push Powell perilously close to 3490′, but the DCP drought operations option, plus a strong desire of Reclamation NOT to lose hydropower at Powell (my opinion) make predictions beyond that point pretty nebulous. As long as the UB states have a significant compact credit, I don’t see them pushing for more releases at the expense of losing HP production.
John C, the flexibility that Reclamation has to manipulate Powell releases certainly does complicate the ability to forecast future reservoir elevations. However, the Lower Basin gets increasingly hurt as Powell releases drop below 8.23 MAF/year. For instance, I’m projecting that with an 8.23 MAF release this year, Powell will drop by 27 feet (to around 3582′), and Mead will lose 10 feet to around 1080′. The rate of storage loss at Mead accelerates as Powell releases drop below 8.23MAF, and next year, the Lower Basin is going to be looking at the prospect of substantially greater delivery curtailments when Mead drops below 1075′. I don’t know how the Dept of Interior would balance the sharing of pain among the Upper and Lower Basins under a repeat of 2000-2004 hydrology. BUT there is another choice available to us: begin implementing an aggressive demand management plan in both sub-basins, and begin refilling both Powell and Mead. That’s the subject of my next blog!
I think “sneaky” is too nice. The San Juan, Dolores, and Gunnison basins have been crummy most of the winter, and the Green and Yampa have bumped along average. Basins further west in Utah not much help. Not too surprising where we are. Hope everyone is staying well!
Pingback: Piñon mysteries: updated again – dream ranch