
End of Water Year 2020
Shrouded in pandemic fog, I’m only now getting to my sorta annual “Happy New Water Year!” post, where I traditionally look on in alarm at dropping Colorado River Basin reservoir levels and make fun of the Lower Basin for using too much water.
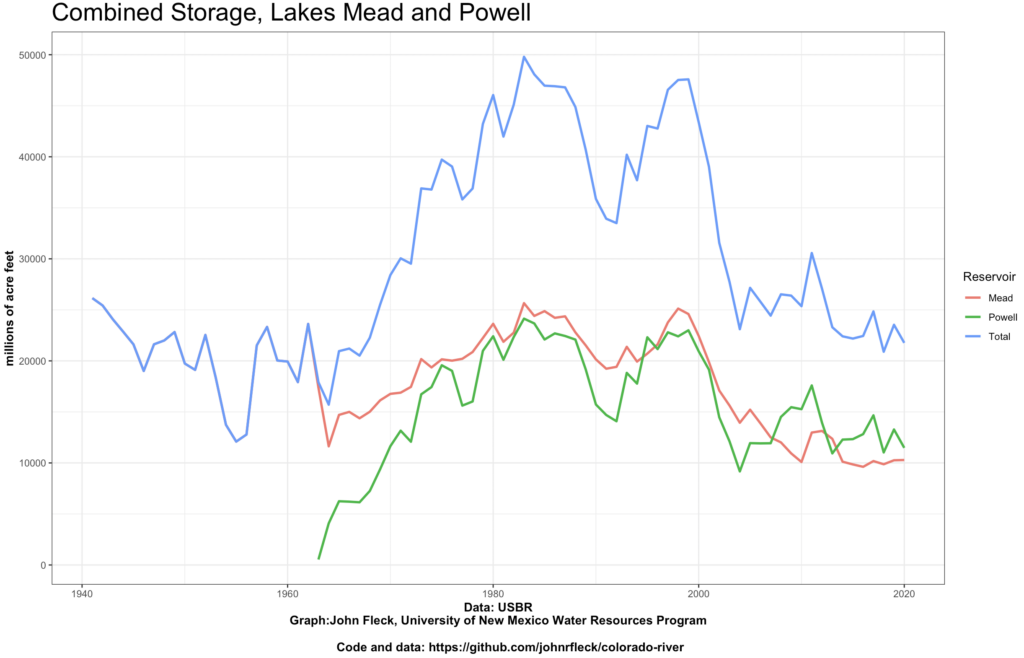
The alarm remains – after a crappy runoff, combined storage in the two big reservoirs behind Lake Powell and Lake Mead is down 1.7 million acre feet from a year ago. For the ~40 million people depending on the Colorado, this is cause for concern. But the water use trends continue to bend in a way that has taken some of the steam out of my old jokes about users wasting all their bonus water on “hookers and blow”.
Reviewing the ’07 Guidelines
The start of water year 2020-21 offers a good moment to look back beyond a single year and see how the basin’s been doing.
Doing trend line analysis is always a rigged game, because so much of what you see depends on the arbitrary starting point you use.
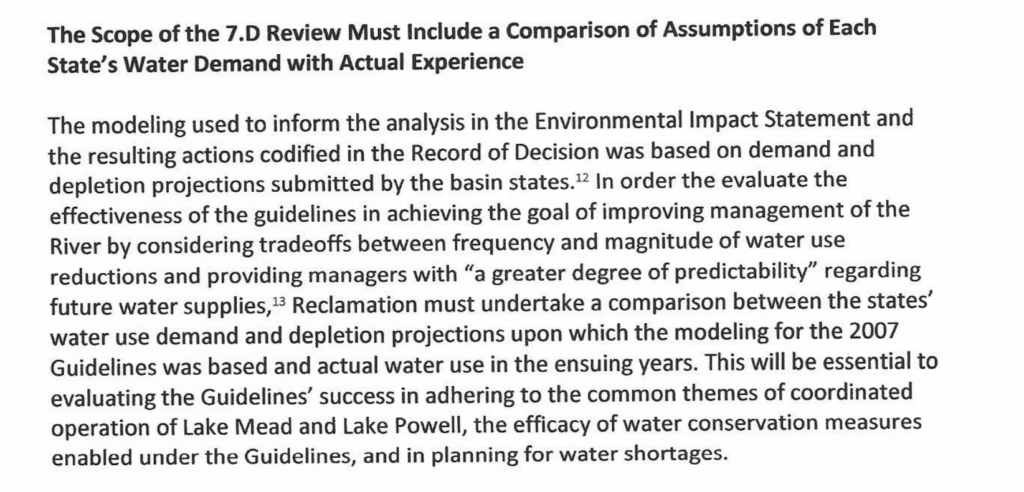
But with the Bureau of Reclamation in the midst of its review of the basin’s 2007 Interim Guidelines, we have a non-arbitrary starting point at which to look at trends. 2007 is when the basin first adopted what we might think of as “drought operation rules”, aimed at reducing the decline of the two big reservoirs.
So, since 2007, how has the basin done?
Shrinking supply
From the supply side, things look bad. The river’s flows since 2007 have been ~1.2 million acre feet below the long term averages fed into the model projections done in support of the development of the 2007 guidelines, an 8 percent reduction in flow. The climate change shark is, as Brian Richter noted recently, circling nearby.
But despite that reduction in flow, total storage behind Glen Canyon and Hoover dams, the two primary system reservoirs, has dropped only 2.6 million acre feet. That is far less than you’d expect from 12 years of 1.2 maf per year flow reductions alone.
That kind of a flow reduction should have been enough to nearly empty the reservoirs. Why hasn’t that happened?
Shrinking demand
Because we also have been using less water.
Municipal and agricultural use of Colorado River water since 2007 has averaged 1 million acre feet per year less than the projections used to underpin the analysis done in support of the 2007 interim guidelines. With growing water conservation efforts, 2020 water use is on track to be 1.5 million acre feet below the demand projections used in the 2007 guidelines’ analysis.
Across the Colorado River Basin, among both Upper Basin users and Lower Basin users, folks are using less than their legal entitlement under the Law of the River. This is not enforced conservation. This is folks realizing they’ve got less water, so they’re using less.
As regular readers of this blog know, I think a better understanding of this demand side change is crucial to mapping out our policy options for keeping the reservoirs from collapsing. Here is how a group of academics (myself, Anne Castle, Jack Schmidt, and Doug Kenney) put it in a May 1 letter in response to the Bureau’s request for comments on the scope of its current review of the Interim Guidelines (full letter here):
The bottom line
In fact the modeling done for the ’07 guidelines, when you look at the projections for reservoir levels for the last 12 years, looks pretty good. The levels of both Powell and Mead are well within the range of likely scenarios the Bureau modeled for the Interim Guidelines EIS – a bit below the median, but well above the “OMG SCARY” scenarios the Bureau considered as unlikely but plausible. Our misunderstandings of both supply and demand were, to first order, offsetting errors of roughly the same magnitude. But as we look back in preparation for looking ahead to the next round of negotiations, it’s important to to dig into the details of what we got right and wrong in that remarkable ’07 planning exercise, and why.
nota bene: A huge thanks to Jack Schmidt and Jian Wang at Utah State University for their analysis of Upper Basin demand projections, and especially to Jian for open-sourcing the underlying data.