
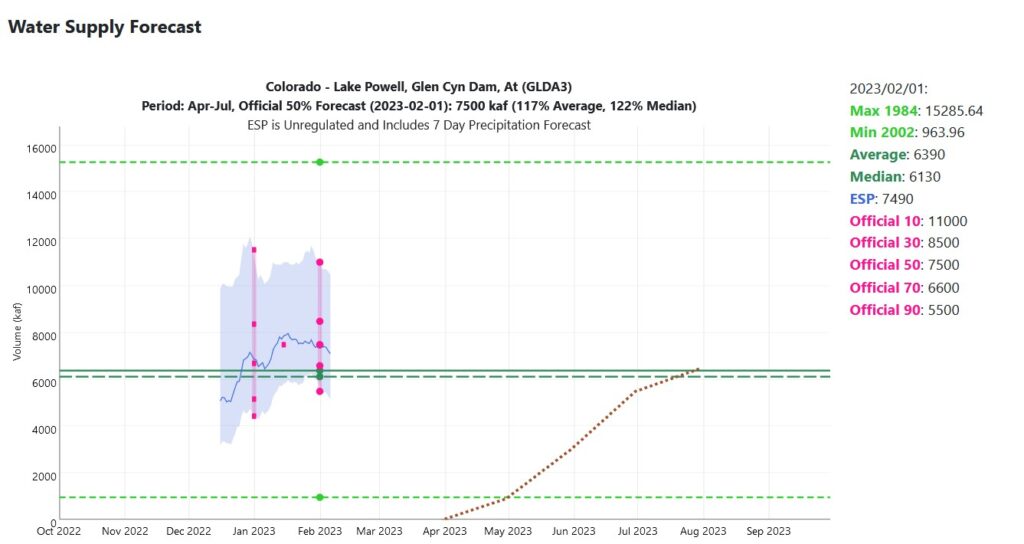
CBRFC forecast: 1.4 million acre feet above median inflow to Lake Powell
The Feb.1 numbers from the Colorado Basin River Forecast Center look good – Lake Powell inflow 1.4 million acre feet above the median.
We’ve got a lot of winter left, so definitely too early to make big plans to, for example, cut Colorado River water use deeply to avoid deadpool or, alternatively, decide that we don’t need to cut Colorado River water use deeply to avoid deadpool.
This morning’s @jfleck rabbit hole contained the numbers for the last decade and a bit from the CBRFC.
On average, the forecast is pretty much spot on. But the distribution is large. For the Polyannas in the audience, in 2019 actual flow into Lake Powell was 5 million acre feet above the Feb. 1 forecast. For the Cassandras, in 2012 it dropped by 3.1 million acre feet.
In eight of the last dozen years, actual flow was lower than the Feb. 1 forecast. In the other four, it was higher.
| year | Feb. 1 forecast | final | change |
| 2011 | 9,000 | 11,500 | 2,500 |
| 2012 | 5,050 | 1,910 | -3,140 |
| 2013 | 3,850 | 2,560 | -1,290 |
| 2014 | 7,250 | 6,920 | -330 |
| 2015 | 5,200 | 6,710 | 1,510 |
| 2016 | 6,400 | 6,630 | 230 |
| 2017 | 9,600 | 8,170 | -1,430 |
| 2018 | 3,900 | 2,600 | -1,300 |
| 2019 | 5,300 | 10,400 | 5,100 |
| 2020 | 5,700 | 3,760 | -1,940 |
| 2021 | 3,300 | 1,850 | -1,450 |
| 2022 | 5,000 | 3,750 | -1,250 |
| mean | 5,796 | 5,563 | -233 |
| median | 5,250 | 5,195 | -1,270 |
The CBRFC folks will be explaining the current state of the basin at their monthly forecast webinar this morning (Feb. 7, 2023, 10 a.m. MT, registration stuff here.)
As always, a huge thanks to Inkstain’s supporters, if you find this stuff useful you can help support the blog here.
Although a bit expensive, the Airboren Snow Observatory (ASO) would greatly increase forecasting skill. Given the emergency were facing, the ASO is warrented throughout the Colorado River Basin, not just in a few watersheds of the basin. The following was submitted to the Secretary et al:
“NASA’s Airborne Snow Observatory has been providing LiDAR and spectrometry
data for various watersheds in California to survey snowpack and burn areas. This
level of survey should be extended basin wide to provide better insight on snow
pack, and allow for better data collection and change management.
“The Airborne Snow Observatory is providing California water managers the
first near-real-time, comprehensive determination of basin-wide snow
water equivalent,” said Frank Gehrke, mission co-investigator and chief of
the California Cooperative Snow Surveys Program for the California
Department of Water Resources. “Integrated into models, these data will
enhance the state’s reservoir operations, permitting more efficient flood
control, water supply management, and hydropower generation.’
press release here:
https://www.nasa.gov/home/hqnews/2013/may/HQ_13-131_Airborne_Snow_Mission.html
Doug – I’m curious about your thoughts on the relative size of the two big uncertainties here – the uncertainty in our knowledge of the size of the February snowpack (which ASO can help with) and the uncertainty about the weather between now and summer, which we’re stuck with for now.
Many of us are worried we see no definite programs, steps outlined! I’m a water worker, AZ state. Easy, get rid of alfalfa growing! Even outlawed in Saudia Arabia!
$ n workshops for homeowner retro fit or outdoor water capture etc. Don’t say it’s up to the homeowner like last group, that didn’t even recognize stream flow necessary to measure.
https://en.wikipedia.org/wiki/Precautionary_principle
HI John,
Let’s just say quoting Donald Rumsfeld has come to mind, but perhaps wouldn’t be that helpful ( ie, we know what we know, we know what we don’t know, and we don’t know what we don’t know…)
There was a recent presentation I believe by NASA showing the location of snow pillows in the Upper Basin in relation to the physical geography of Upper Basin watersheds, showing how limited our knowledge of the snowpack is based on point precipitation values –(snow pillows). Hence the need for ASO, as extrapolating point values over an entire watershed lends to large uncertainty, which gets incorporated into the forecast. Image trying to operate the system in the early 1980’s without the systems in place now! Quantifying the uncertainty in the snowpack forecast is directly tied to our measurements; im sure there is a study that has been done on this somewhere….this is different from quantifying the uncertainty related to the unregulated inflow forecast into Powell, which involves not just the water content of the snowpack, but also the physics of the atmosphere and dryness of Upper Basin soils, as related to aridification.
As for uncertainty with the weather, maybe this falls into the ‘we know what we dont know category'(?) –I’d certainly have to defer to experts like Daniel Swain out at UCLA, (or Scrips, or NCAR)…in my humble opinion the common theme is higher variability, generally a result of higher energy and heat in the atmosphere (to state the obvious). How to quantify the uncertainty in the forecast caused by this would require highly sophisticated atmospheric modeling on a global scale, capturing not just teleconnections to the Colorado Basin, but also capturing extreme detail on a smaller scale involving idiosyncrasies of local geography…I’m not sure what the latest state of the science is…
Realizing this as an operator, especially with high risk assets on the Colorado River system, I started to explore forecasts assisted by data assimilation. In other words, after receiving the forecast, I wanted to check the forecast, whether short term or mid-term, by having a big honking computer ingest as much data on the current condition, then compare the current condition with past conditions, mostly to quantify the uncertainty in the forecast based on ongoing changes in the atmosphere. So, for example, CBCRC issues a forecast for the Santa Margarita River upstream of Alamo Dam in the Bill Williams watershed. Five days out there is 100,000 cfs forecast at a gage on the river; three days out the forecast is 50,000 cfs, and the day before its reduced to 10,000 cfs. What is needed was something that could quantify this uncertainty at day -5 to better understand the risk, or threat, allowing the operator to optimize dam operations….data assimilation could do this…and it should be made a part of the new 2026 operations guidelines
So, in true John Fleck fashion, I input the following question into ChatGPT:
How does data assimilation work to improve the weather forecast?
And here was the response:
Data assimilation is a process used by numerical weather prediction models to improve the accuracy of weather forecasts. It combines observed data with the model’s predictions to produce a more accurate representation of the current state of the atmosphere.
The process works by using a combination of mathematical algorithms and computer models to estimate the state of the atmosphere at a given time. This estimation is based on a combination of data from various sources, including weather balloons, satellites, radars, and ground-based observation stations.
The model uses this estimated state to make a forecast for the future. However, the accuracy of the forecast can be limited by the limited amount of data available and the inherent uncertainty in the model’s predictions.
Data assimilation helps to overcome these limitations by using the observed data to update the estimated state of the atmosphere and improve the accuracy of the forecast. This is done by using mathematical algorithms to compare the observed data with the model’s predictions and to adjust the estimated state accordingly.
The resulting improved estimate of the current state of the atmosphere is then used as the starting point for the next forecast, which is made using the latest available data and the updated estimated state.
In this way, data assimilation helps to continuously improve the accuracy of the forecast over time, resulting in more reliable weather predictions.
Very scary!