
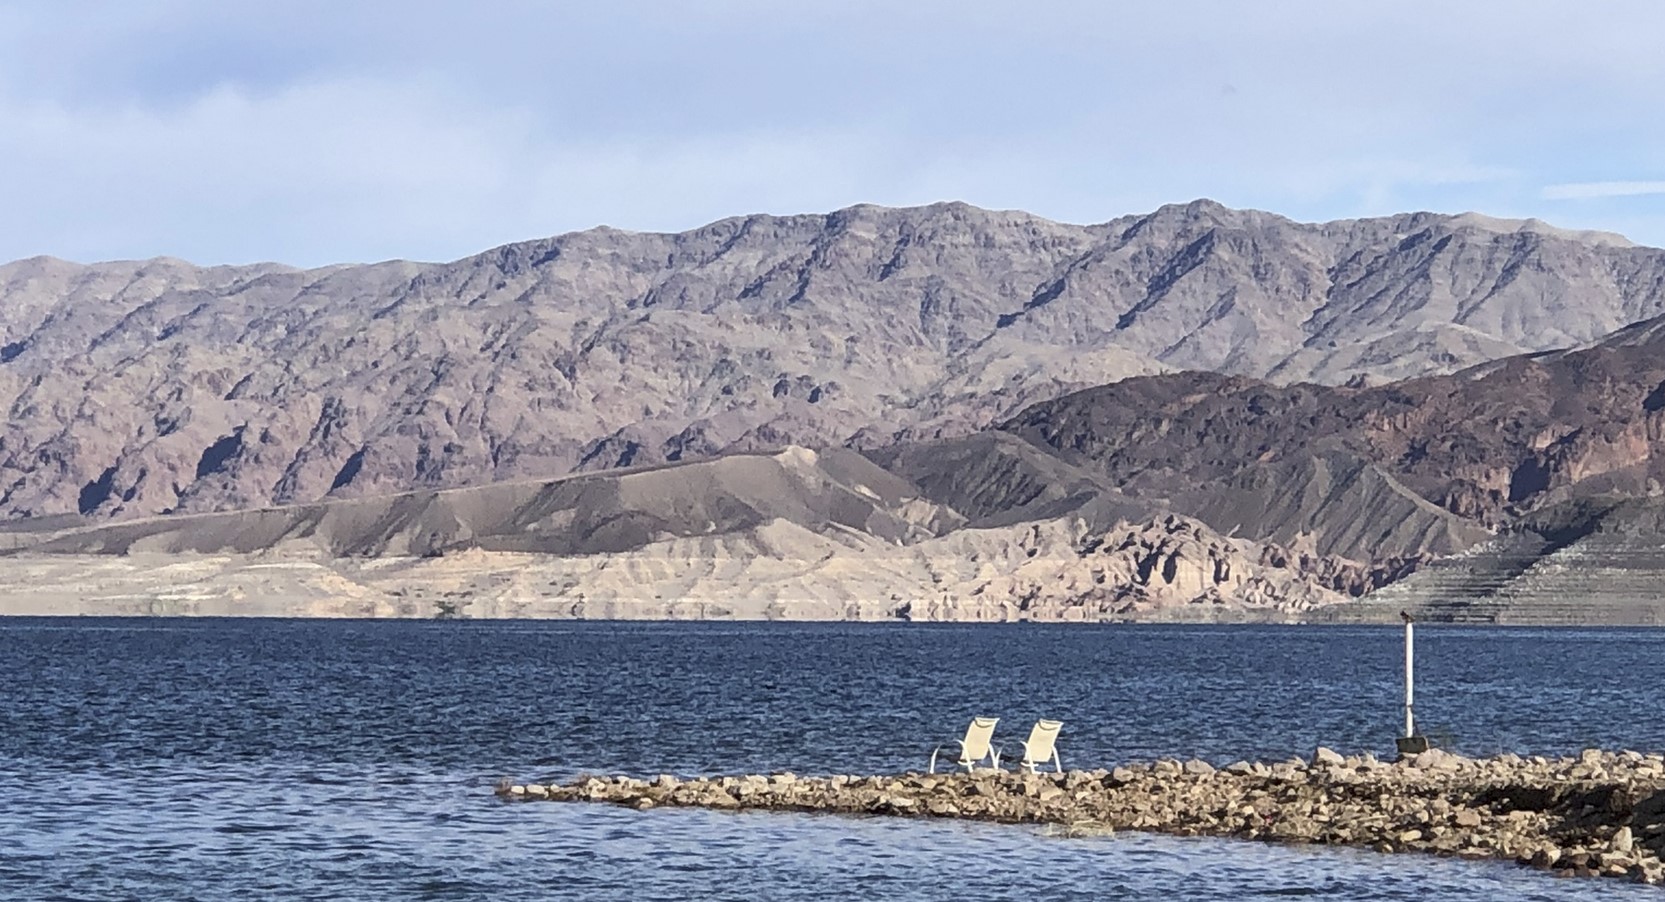
Sometimes all we can do is sit and watch and wonder
When last we visited, Lake Mead sat at elevation 1,054.28 feet above sea level. It’s now at 1,058.34, which is up ~13 feet from when I took the above photo last December.
I hope they moved those chairs.
The good news is the current forecast calling for the combined storage of Lake Mead and Lake Powell to end the water year up nearly 5 million acre feet from a year ago.
The bad news is that total identifiable water use reductions in this year of chaotic crisis fire drill total just 1.2 million acre feet, according to the Bureau of Reclamation’s July 14, 2023 forecast.
| State | Base allocation | 2023 | 2023 reduction | percent cut from base | 07/DCP | Cut beyond 07/DCP |
| California | 4,400,000 | 4,068,756 | 331,244 | 7.5% | 0 | 7.5% |
| Arizona | 2,800,000 | 2,008,505 | 791,495 | 28.3% | 592,000 | 7.1% |
| Nevada | 300,000 | 201,923 | 98,077 | 32.7% | 17,000 | 27.0% |
| Total | 7,500,000 | 6,279,184 | 1,220,816 | 16.3% | 609,000 | 8.2% |
This is not enough.
Who’s Using What?
Kudos to Southern Nevada, which at ~202kaf is on track for its lowest take on the Colorado River since 1992. Clark County’s population has nearly tripled in that time.
At ~860kaf, the Central Arizona Project is on track to make its lowest draw on the Colorado River since 1995.
At ~803kaf, the Metropolitan Water District of Southern California’s forecast draw on the river is taking 12.5 percent less than its average over the last decade, but Met is weird because of California State Water Project wet year chaos, so I’m not sure I fully understand what they’re up to. (Jump in the comments and explain, Met friends!)
The Imperial Irrigation District is forecast to take ~2.5maf from the river this year, which is basically unchanged from its use over the previous decade.
What is Needed
The analysis by Jack Schmidt et al suggests that, based on 21st century hydrology, we need to cut 1.5 million acre feet per year just to stabilize the system. If we want to actually refill a bit, to provide cushion against the sort of catastrophe that was narrowly averted this year by a big snowpack, the cuts need to be even deeper.
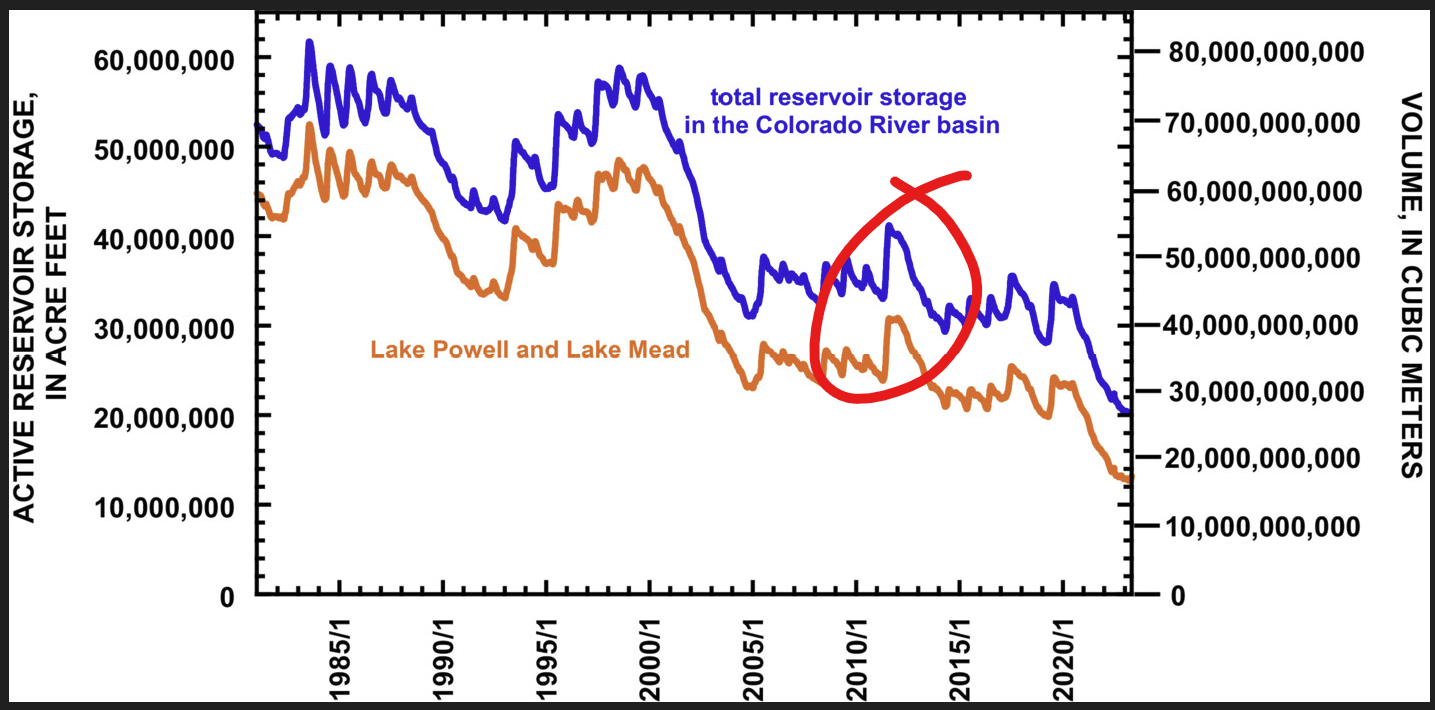
Four decades of dithering, with the last big snowpack circled in red.
The above graph from their paper shows the problem. I’ve circled the last big snowpack year in red, and you can see the others as well. Every time we got bonus water, we just used it.
We need to avoid making that mistake again.
Thanks
A big thanks to friends of Inkstain for helping support this work.
Just finished reading Brave the Wild River by Melissa Sevigny. A most superlative book! Very happy to see John Fleck listed in the credits. Every time I came across the name LaRue, I recall your mentions of him.
Thanks John, nice summation. Couple thoughts: can you or Jack highlight the last time in the record a big snow year was followed by a strong El Nino? And, the analysis indicates to me the continued value of completing the SEIS and describing DOIs discretion for rhe contemplated future dry periods.