
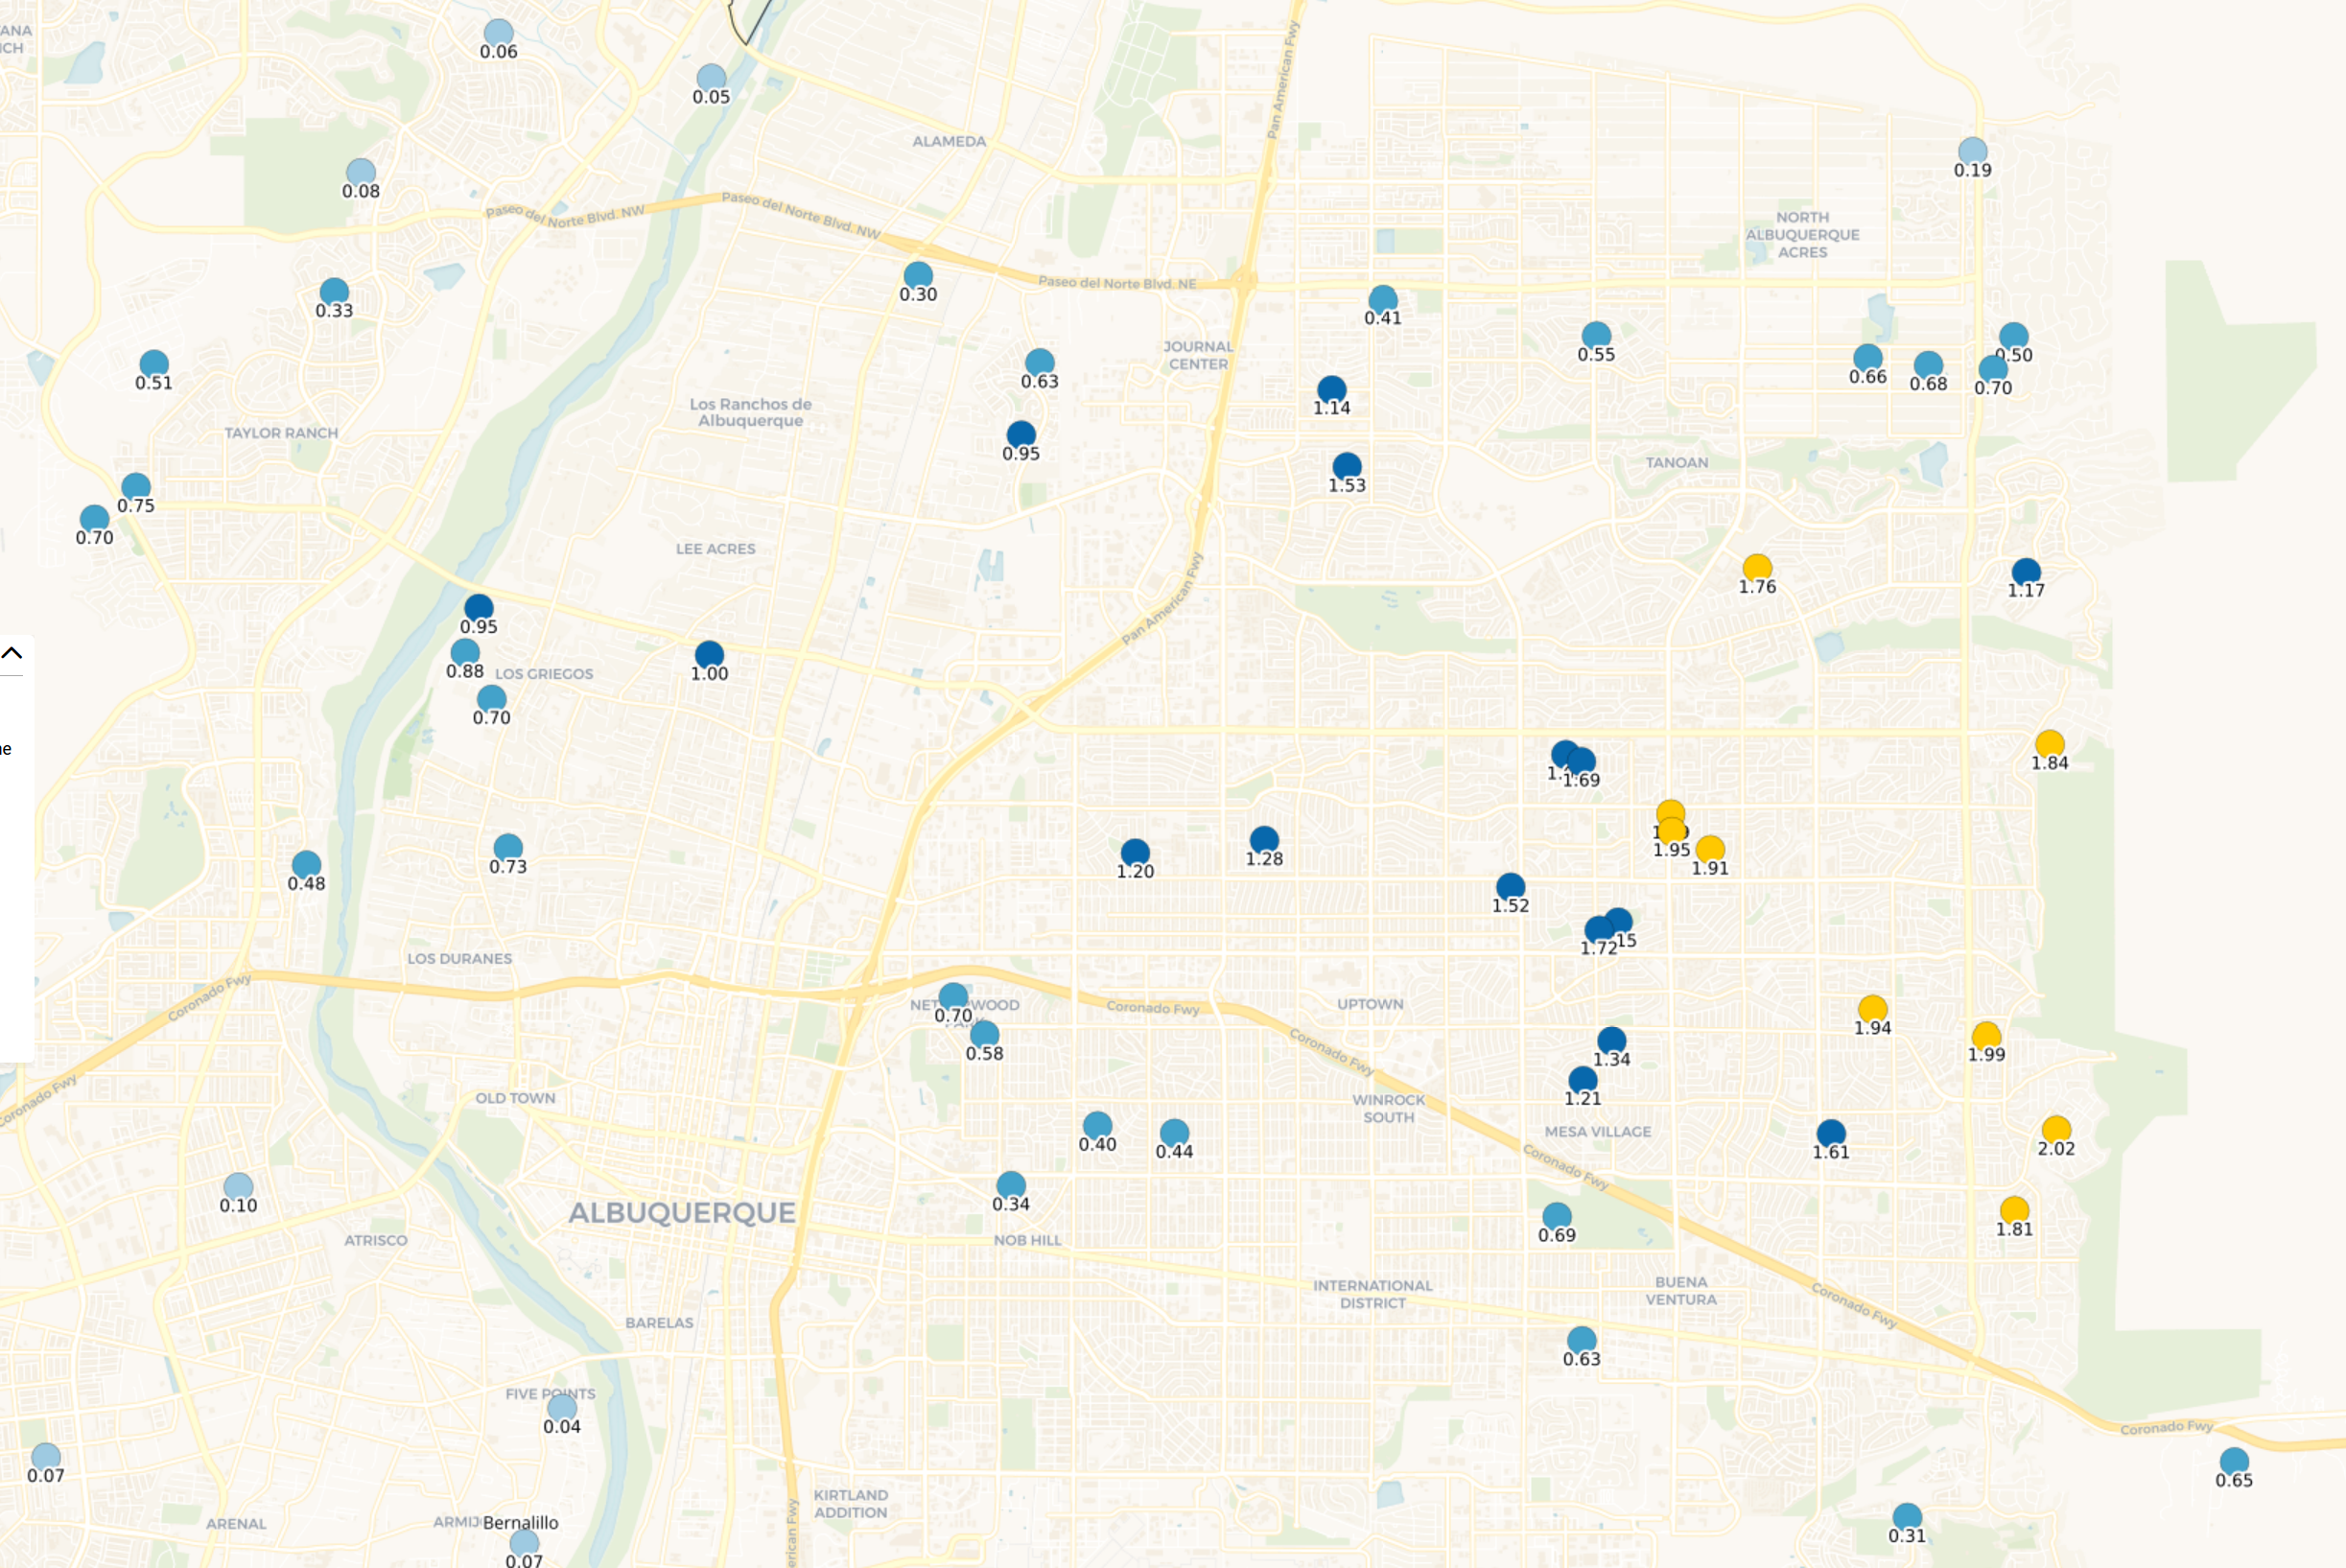
Breaking a flash drought: Aug. 8, 2023 rainfall in Albuquerque, Courtesy CoCoRaHS
August 8 is more than a little late for Albuquerque’s first solid monsoon rains to break our weirdly hot flash drought, but we’ll take it.
Typical monsoon onset here is early July, plus or minus a week-ish. At the risk of overstating because of a lack of precision, Aug. 8 is record late.
I was on a Zoom yesterday with a group of Colorado River colleagues when my phone started pinging insistently with the family’s traditional “rain here!” and “thunder!” from the various Fleck and Co. outposts scattered around Albuquerque’s city center. The rainfall numbers from CoCoRaHS volunteers, shown above, show a classic monsoon storm variability, but you can see the numbers growing as the cell(s) rolled up toward the foothills on the eastern side of the map.
Biggest Monsoon Storm by Fleck’s favorite measure in a decade
One good measure of the scale of these storms with respect to the city is Albuquerque’s North Diversion Channel, which collects runoff from the city’s built-up Northeast Heights, where most of us live. The channel integrates across a much more meaningful area than any single rain gage – the area where a bunch of us (including me!) live. The NDC peaked yesterday afternoon a bit after 3 p.m., just after my Zoom ended, at 7,630 cubic feet per second. That’s not a meaningful number for lots of you, so by point of comparison it’s our biggest NDC flow (and therefore the biggest single monsoon storm across this part of the city) since July 2013. (USGS data sources: NDC gage)
Ribbons of Green
For the new book, we’re writing a series of vignettes that track the Rio Grande over the course of a single year. For convenience sake, we’ve chosen this one (duh), so this stuff’ll go into the book. One of the tricks I’m using – this may not go into the book, it’s one of those “Danger, Fleck Doing Math!” things – is to monitor gages at the north end of the Albuquerque reach and the south end, a crude mass balance metric of how much water is being consumed in our stretch of the middle valley. This morning’s additions to my spreadsheet showed the reach adding water for the first time since I started keeping track. Usually we subtract water – which is to say, evaporation in this stretch of the river is what keep’s the valley green.
All of the storm’s water dumps into the Rio Grande in a hurry, through a network of concrete diversions channels mostly built in the 1970s as the city spread up onto the mesa on the river’s east side. It’s a sharp peak at the NDC outfall, but by the time the pulse reached the Central Avenue Bridge ~8 p.m. (five hours’ travel time) it was down to ~2,500 cfs. The volume of water probably shrank as some of it spread out into the bosque, but mostly it just spreads out in time, a sort of sloshing effect.