
A guest post by Jack Schmidt of the Utah State University Future of the Colorado River Project.
By Jack Schmidt
The end of September marked the end of Water Year 2023 (WY2023). This is a good time to take stock of the year’s runoff and to understand how much reservoir storage improved. What kind of a year was WY2023? How long will any added storage last? Can we ease our collective effort to reduce consumptive uses and losses in the basin?
In Summary
The short answer is that WY2023 was certainly a good year for runoff, reservoir inflow, and increases in reservoir storage—but the same amount of inflow would have to occur for several additional years to fully recover storage to what it was in summer 1999 when the system was last full. Such a string of high flow years has not occurred in the 21st century and is unlikely in the future.
History also warns that we should work to conserve the gains of WY2023. In notably wet WY2011, WY2017, and WY2019, extra storage that accumulated during each year’s snowmelt runoff was totally consumed in approximately two years. Thus, our past shows that there is potential to quickly consume the benefits of a good water year. We’ve done it before. It is imperative to keep a keen eye toward accomplishing significant reductions in water use throughout the basin to save what we have gained. We should not expect Mother Nature to bail us out again.
The Details
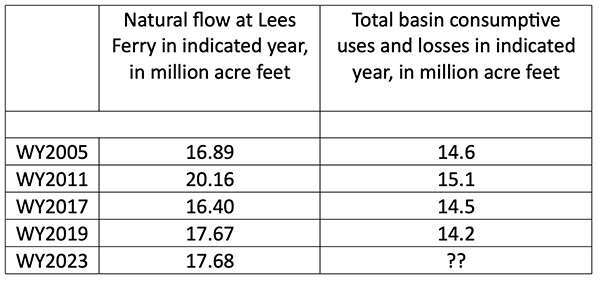
Estimates of WY2023 unregulated inflow and natural flow indicate that the year’s runoff was the second largest in the 21st century, exceeded only by WY2011. The Colorado Basin River Forecast Center estimates that the April to July unregulated snowmelt inflow to Lake Powell was 10.6 million acre feet (maf) and that the total unregulated inflow for the year was 13.4 maf. Reclamation estimates that natural flow at Lees Ferry in WY2023 was 17.7 maf (Table 1). Unregulated inflow is the estimated stream flow if little of this year’s runoff had been stored in reservoirs upstream from Lake Powell, and natural flow is the estimated flow at Lees Ferry if there were no reservoirs in the basin and no upstream consumptive uses.
Table 1. Natural flow and total basin consumptive use in the five largest runoff years of
the 21st century. Total basin consumptive use includes reservoir evaporation and use
by Mexico but does not include use in Lower Basin tributaries.
Data concerning reservoir storage are made available by Reclamation at their comprehensive basin-wide hydrologic data base. Daily water storage data are available for 46 reservoirs in the basin including all the large reservoirs and many small ones.
Figure 1 shows how reservoir storage changed during the 21st century. Total storage in all the reservoirs reported in Reclamation’s database is shown in blue, and storage in the three different parts of the watershed are distinguished. Between 60 and 80% of all reservoir storage in the basin occurs in Lake Mead and Lake Powell (orange line). Between 16 and 32% of basin reservoir storage occurs in the many reservoirs upstream from Lake Powell (green line), and between 4 and 8% of basin storage occurs in Lake Mohave and Lake Havasu (red line) that are downstream from Hoover Dam.
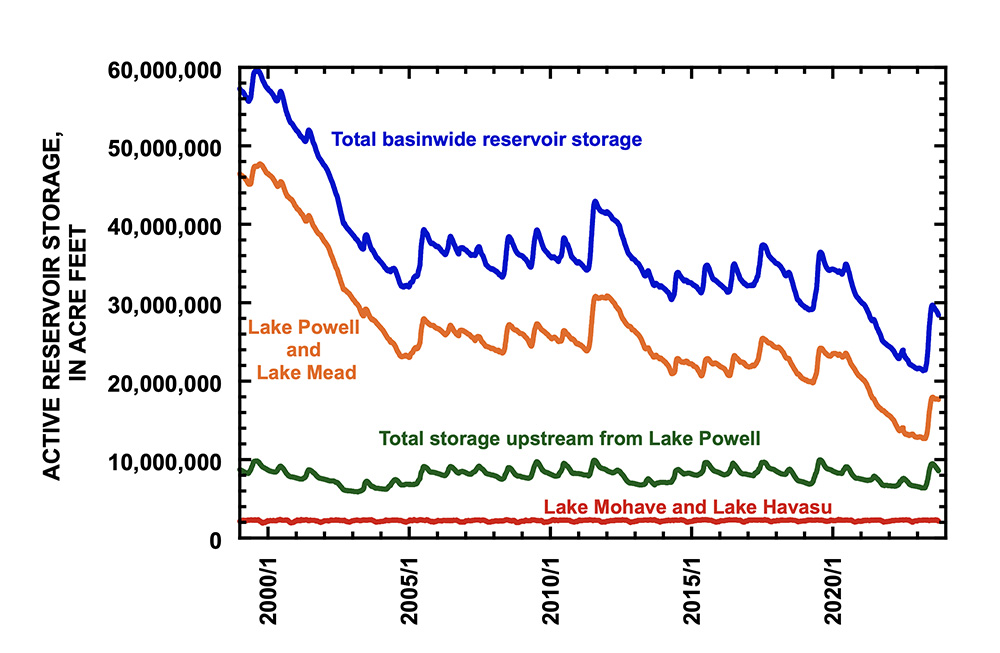
Figure 1. Graph showing daily storage contents of reservoirs of the Colorado River basin, as reported by Reclamation, between 1 January 1999 and 30 September 2023. Data do not include reservoirs on Lower Basin tributaries.
The most striking trend in these data is that reservoir storage decreased greatly between August 1999 and October 2004 when total storage decreased by 27.4 maf and storage in Lake Mead and Lake Powell decreased by 24.5 maf. There was a small amount of recovery in storage between October 2004 and August 2019; total basin storage increased by 4.1 maf, and storage in Lake Mead and Lake Powell increased by 0.9 maf. Between August 2019 and March 2023, storage plunged again, decreasing by 14.8 maf in the entire watershed of which 11.4 maf was lost from Lake Mead and Lake Powell. These trends were described in more detail by Schmidt, Yackulic, and Kuhn (2023, The Colorado River water crisis: its origins and the future. WIREs Water).
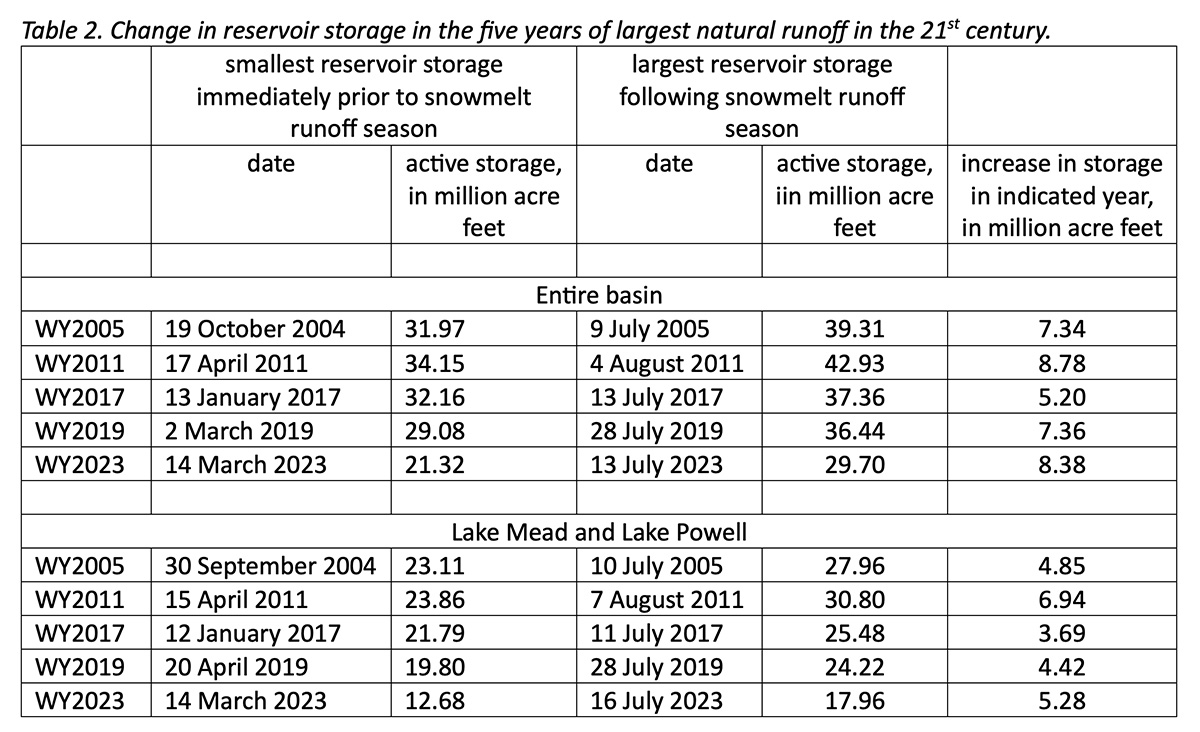
On 30 September 2023, the total storage in the watershed’s reservoirs was 28.4 maf, of which 62% was in Lake Mead and Lake Powell. The storage in all reservoirs upstream from Lake Powell was 8.6 maf and comprised 30% of the total basin storage. Total basin storage in WY2023 peaked on 13 July at 29.7 maf, and the combined storage in Mead and Powell peaked on 16 July at 18.0 maf (Table 2).
How does this year’s increase in storage compare to increases in other years of large inflow? At the beginning of the WY2023 runoff season in mid-March, total reservoir storage in the basin had dwindled to 21.3 maf (Table 2), which is approximately 18 months of supply, based on the average basin-wide water consumption rate for 2016-2020. The combined storage contents of Lake Mead and Lake Powell was 12.7 maf.
Between mid-March and mid-July, total basin-wide storage increased by 8.4 maf, of which 5.3 maf accumulated in Lake Mead and Lake Powell. In comparison, the other four large runoff years of the 21st century — 2005, 2011, 2017, and 2019 – resulted in increases in basin reservoir storage between 5.2 and 8.8 maf and increases in storage in Lake Mead and Lake Powell between 3.7 and 6.9 maf (Table 2). Not only was WY2023 the second largest runoff year of this century, but reservoir storage increase was also the second largest of the century.
Nevertheless, the increase in reservoir storage in WY2023 was small in comparison to the total loss in storage that had occurred since summer 1999. Between August 1999 and March 2023, the reservoir system lost 38.1 maf, and the increase in storage in WY2023 was only 22% of that amount. It would take another 3 to 6 years of very large runoff to fully recover the basin’s reservoirs to what they had been at the turn of the 21st century.
It is unrealistic to expect that the next several years will be similar to the remarkable winter of 2022-2023. No other high flow year of the 21st century was immediately followed by another high flow year. Our best hope for achieving sustainability in water supply is for the Basin States and the federal government to reach new agreements to greatly reduce basin-wide water use so that the modest recovery in reservoir storage in WY2023 might be preserved. Otherwise, our gains may quickly disappear.
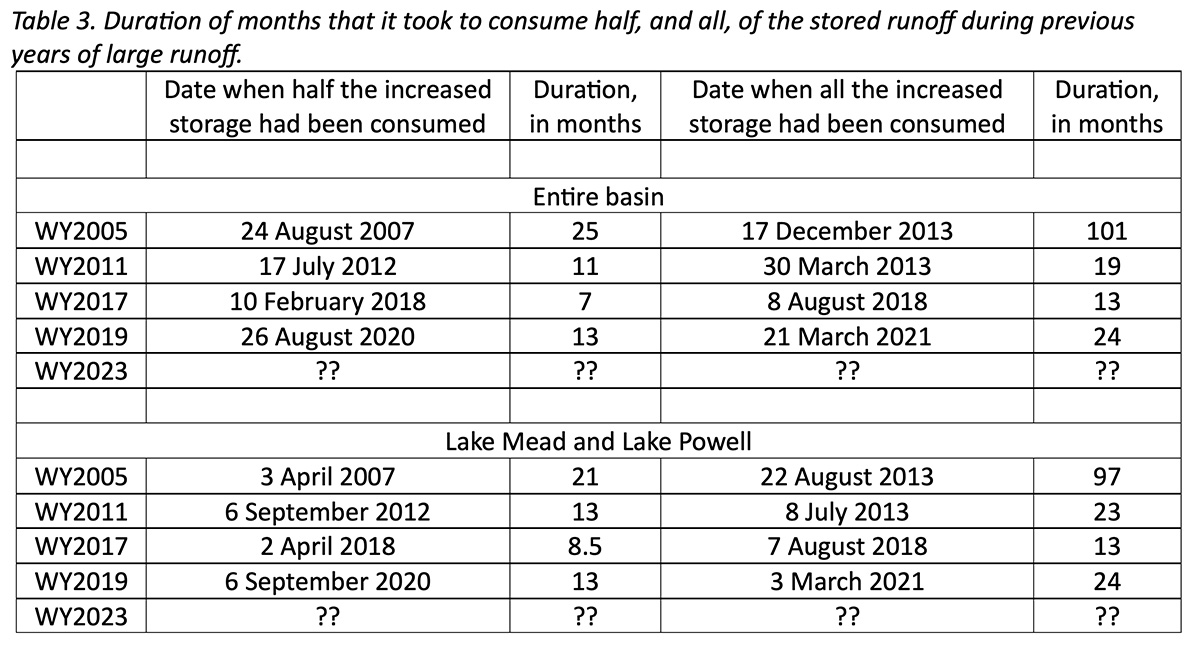
Historical data from the previous wet years of this century provide a cautionary tale about how slowly the political process responds to the opportunity provided by a wet winter. Table 3 summarizes the duration of months it took to consume the increased supply of each of the previous years of large runoff. Half of the supply provided by the largest inflow year of WY2011 was gone 11 to 13 months after peak storage had occurred in early August 2011; 8 to 10 months after that, all of WY2011’s large runoff had been consumed (Table 3). The historical story is the same for WY2017 and WY2019.
Since mid-July when the snowmelt season had ended, reservoir storage has begun to decline. The basin’s reservoirs lost 1.3 maf of storage between mid-July and 30 September of which 0.3 maf was lost from Lake Mead and Lake Powell and 0.9 maf from the reservoirs upstream from Lake Powell. The total consumption in these 2.5 months was 16% of the “benefit” of WY2023. Today, the contents of Lake Mead and Lake Powell are about the same as what they were in mid-June 2021.
A Last Thought
One strategy for maintaining a public focus on water conservation would be to widely report—every month—changes in total reservoir storage. The Basin States, and the basin’s citizens, would benefit from knowing the rate at which we are consuming the bounty of the WY2023 supply. It would be especially useful to know the point in time when we consume half of what we gained this year. If we reach that point in less than a year, we would have fair warning that the political process by which we now seek to reduce water consumption is too slow. Hope for a secure and sustainable water supply must rely on nimble and adaptable strategies for reducing water consumption and saving the gains of each wet year.
Seems that all of the data prove that we are dealing with an essentially unpredictable stochastic system and just because several water short years occur several abundant water years happen later. Everyone wants absolute certainty, and you can’t have it without fixing a determinable and long-term absolute demand. Water planners are always trying to find more water while unable or disinterested to control demand.
Very thorough and readable analysis. Thank you for sharing. This fact says it all–we keep living for the past, not for the future.
“Between August 1999 and March 2023, the reservoir system lost 38.1 maf, and the increase in storage in WY2023 was only 22% of that amount.”
Thanks Jack for the really thoughtful analysis. Given your message, I’m guessing you are concerned that the SEIS released yesterday has elevated the “no action” alternative (for operations through 2026) as one of 2 remaining choices, which seems to indicate a belief that the situation, at least for now, is under control.
Doug,
note that the Reclamation press release only says, “we are confident that the system won’t crash before 2026.” The time series shown in Figure 1 of my Post, and also described in Schmidt et al (2023), shows that the 21st century was characterized by a big crash (2000-2004), stasis without recovery of storage (2005-2019), and then a second crash (2020-2022). The press release concerning the new SEIS merely says “we’ll have stasis and probably won’t have another crash.” I would argue that is not the point … unless the basin-wide cuts in consumptive use result in significant recovery of lost storage, we will continue to live on the edge of yet another water-supply crisis whenever the next string of dry years occurs. We seem poised to repeat the mistakes of the past.
Scientists: Climate emergency threatening life on Earth
Record high temperatures, ocean acidity and other metrics indicate the climate emergency has pushed the Earth into “unchartered territory” and its ability to support life is “under siege,” according to a report signed by more than 15,000 scientists. The report pointed to bright spots such as the growth of renewables, but suggests humanity may need to rethink its perception of economic growth. “We therefore need to change our economy to a system that supports meeting basic needs for all people instead of excessive consumption by the wealthy,” wrote the scientists.
Full Story: The Hill (10/24)
Again, we need to control demand for water and learn to live within the means provided by the planet.