
Early spring base flows, before snowmelt begins.
It’s hard to tell this morning what yesterday’s howling dry winds did to our snowpack. It’s the sort of thing that can cause sublimation, which means the loss of snow straight to atmospheric drying without ever having a chance to melt and make it to the rivers. It looks like some snow may have fallen in the high country, so maybe we’re OK?
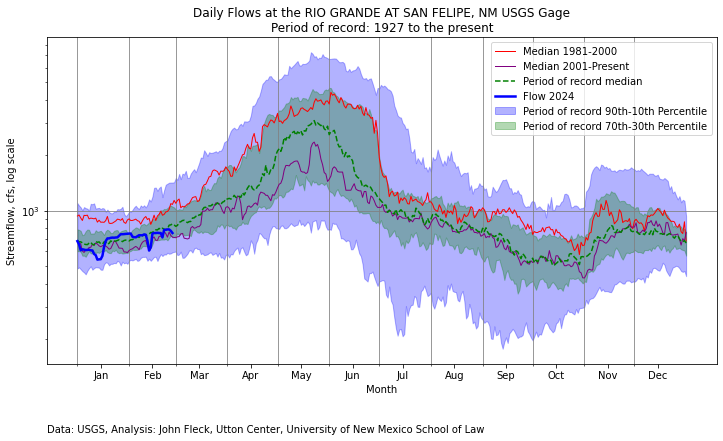
My new Fleck-o-Graph for San Felipe, with the added median lines for 1981-2000 and 2001-present (thanks, Kyle!) shows a pretty “normal” year so far for the 21st century, and also makes clear how anomalously wet the 1980s and ’90s were. That red line is really important, because it documents a sort of “cultural memory” – a period of population growth in New Mexico during an unusually wet time.
I think by now we’ve adjusted our priors, but the 1980s and ’90s linger in the background.
85% of normal in the Upper San Juan with more snow predicted this week. Do you suppose we’ll edge out a normal year yet? How much would it take to fill Elephant Butte, now at 25%?
John, you did a nice article on precipitation in NM back in 2012 when you were at the Journal. I posted a couple of the graphs along with one of water levels in Elephant Butte Lake and a graph of the PDO, all for the 20th Century.
https://labikes.blogspot.com/2018/01/drought.html
Interesting that from May data one can determine October flow. Classic double porosity-type regression curves. Nice that your ordinate uses the log scale. This is correct for this type of plot.