
Still running on empty
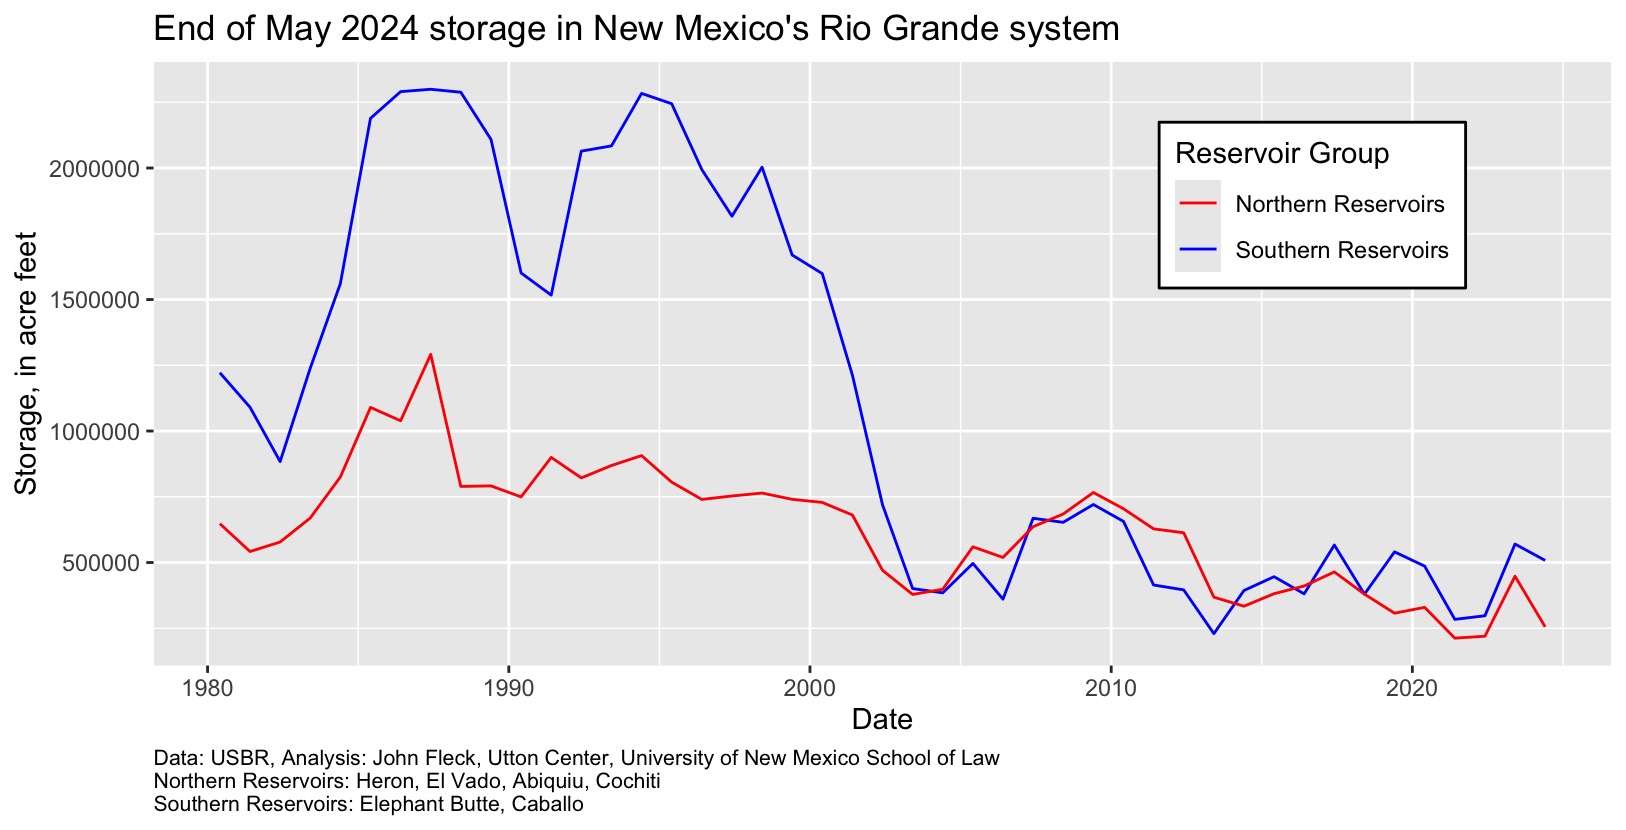
With the snow mostly melted, it’s time for a fresh look at the water storage situation on New Mexico’s Rio Grande – water saved from the spring runoff this year, and carried over from previous years, to use for irrigation, municipal use, and environmental flows during the summer. Total reservoir storage got a bump up last year, but we’ve already drawn down a significant fraction of the gains.
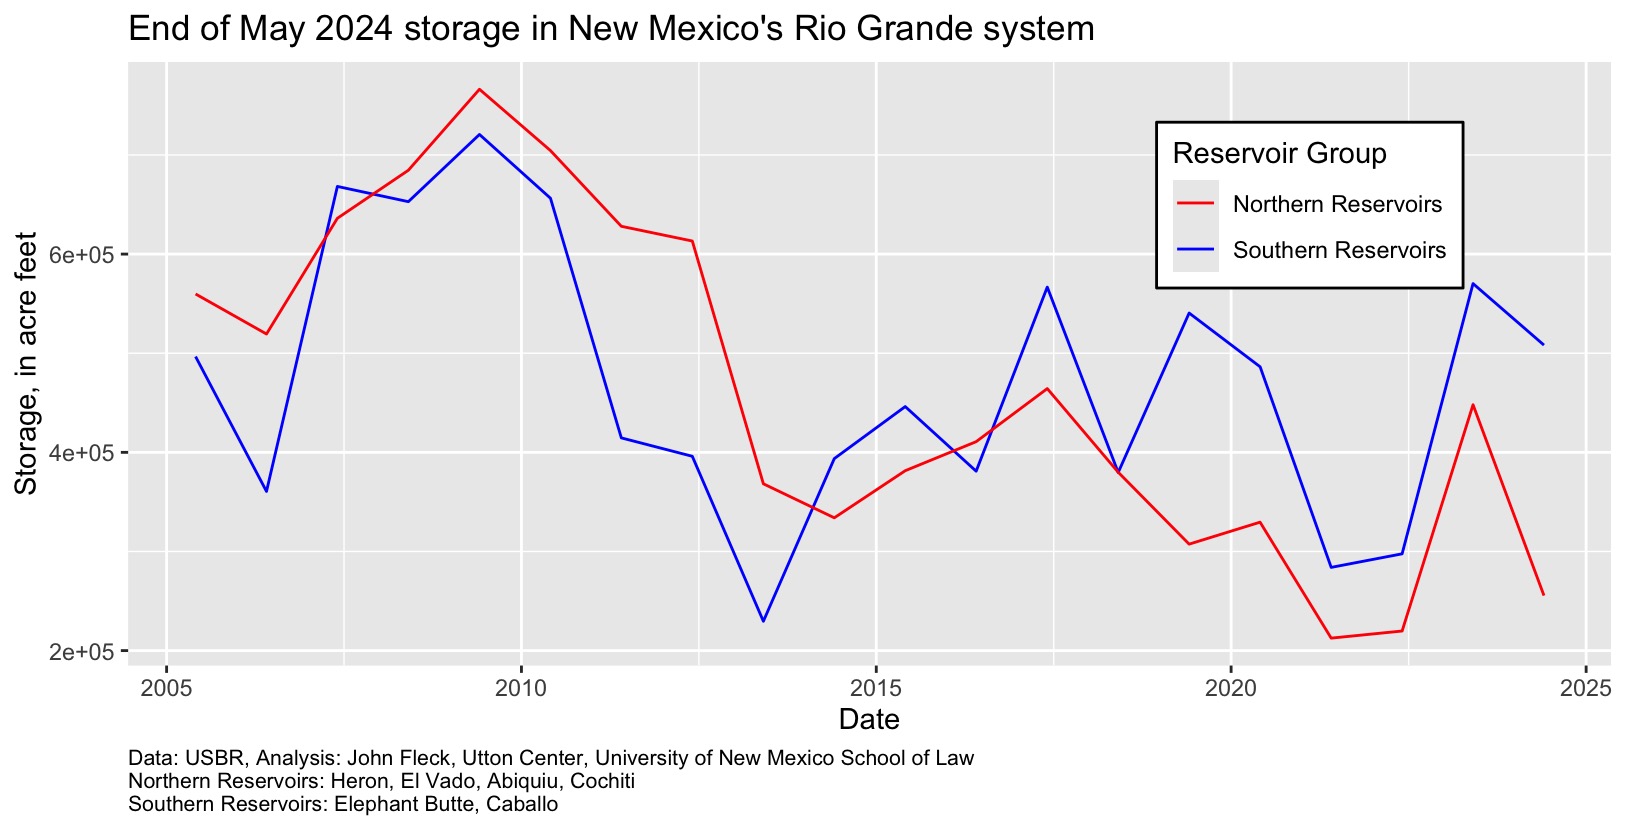
By going back to 1980, the graph above gives a clear picture of the shift from wet to dry as the millennial drought/aridification set in. Within the first few years of the 2000s, we burned through the accumulated bounty of the 1990s. It’s also useful to drill down to the last two decades.
Running on empty 2
Inkstain’s content will always be free. Thanks to my supporters for help keep the lights on and the coffee flowing.
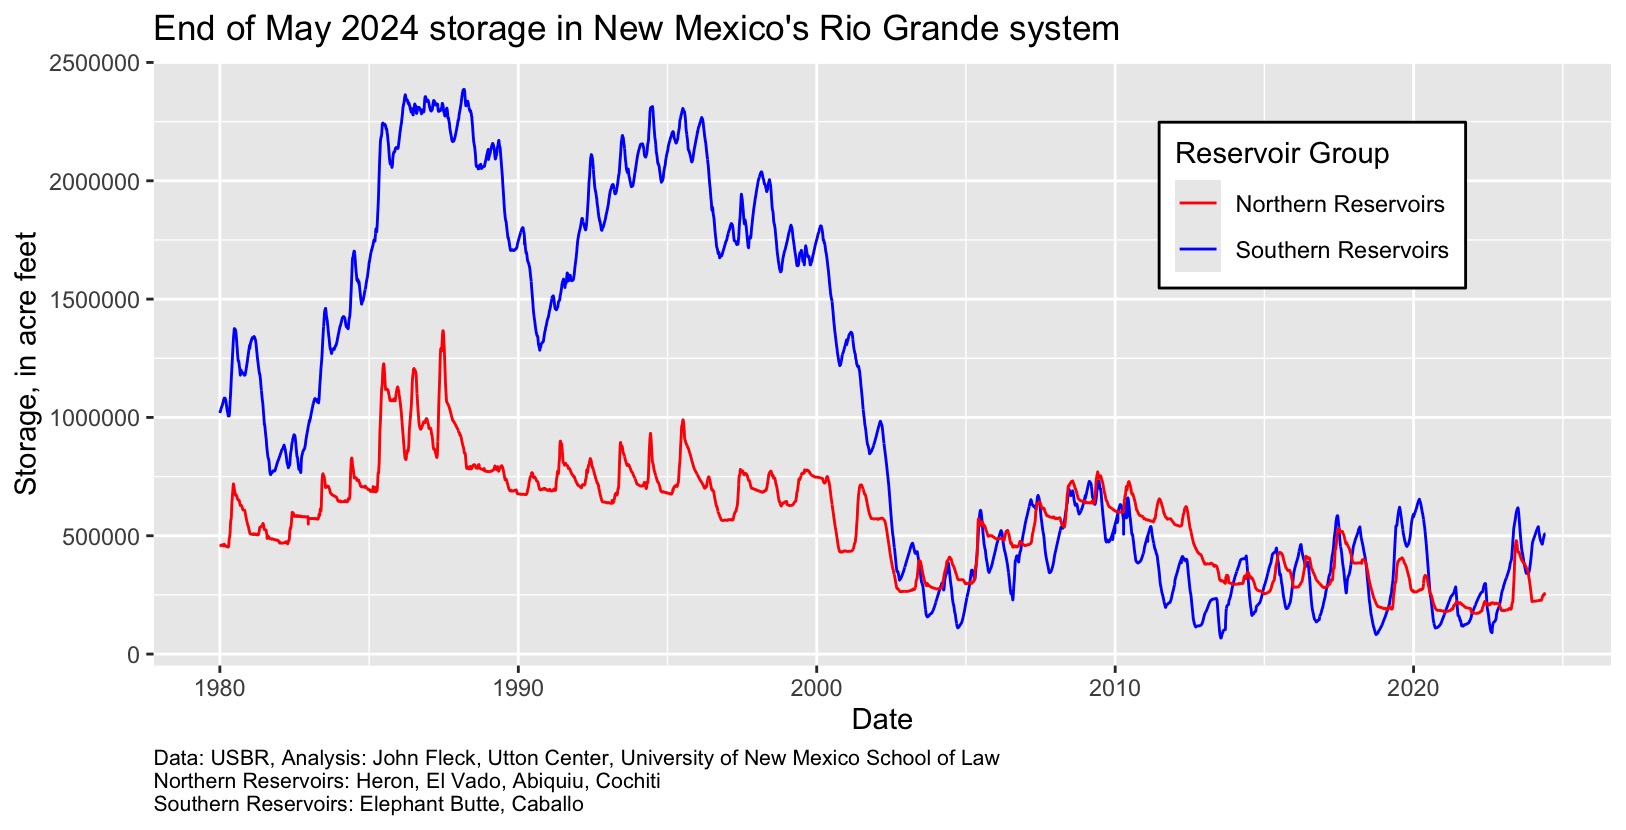
N.B.: My code to generate this matches today’s number with the same day in all previous years. For completeness, here’s the graph of the entire dataset at a daily timestep for those who prefer it.
Running on empty 3
John:
Do these graphs starting in 1916 or thereabouts. I think you will find the period of the 1990 were unusually wet. It was in the1990’s the EB spilled. You will probably find present storage is normal. Everyonne is trying to say we are having scarce rainfall when it is the normal condition. It was the 1990’s that was unusual. So the sky is not falling down as everyone would have it to find money to study water supply into the future and create new water planning institutions. N’est pas? What is lamentable is that we did not have infrastructure in place to capture the water in the wet years and place it underground. Goes to prove no one can be a prophet in his own hometown.
It’s not a hockey stick graph it’s a baseball cap graph