
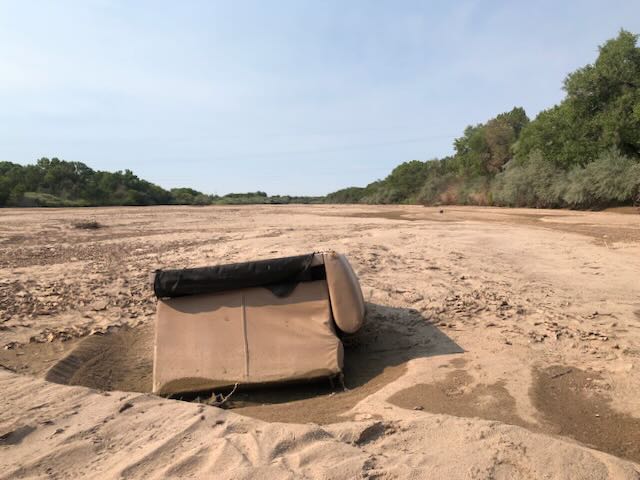
Dry Rio Grande. Albuquerque, July 2025
I spent some time this morning crunching numbers, trying to make numerical sense of how bad this year is on New Mexico’s Middle Rio Grande. We keep saying it’s only the second time the Rio Grande has dried through Albuquerque since the 1980s, but that felt insufficient.
Some data visualization experiments:
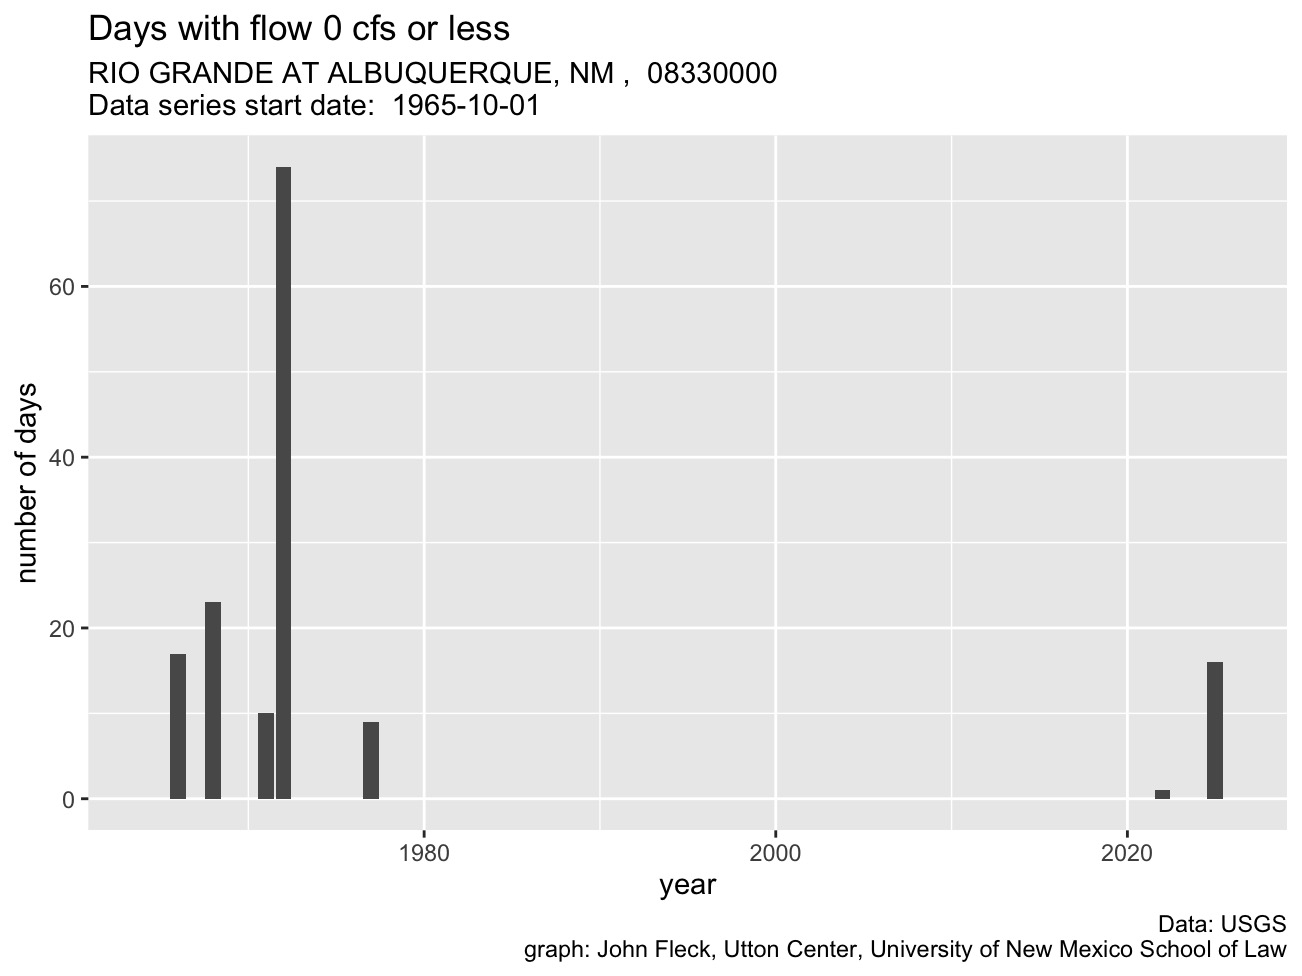
Total days, by year, with a USGS average daily gage measurement of zero at Central Avenue in Albuquerque (forgive the “or less,” the code allows me to look at low flows below arbitrary thresholds)
By this measure – total days measured at “zero” by the USGS gage at Central Avenue in Albuquerque – it’s the driest since 1972, when the river was dry at that spot on 74 days. (Note that if it’s dry at Central, it’s already been dry far longer at points downstream.)
Or this: How much total water is entering New Mexico’s Middle Valley, as measured at Otowi, the gage immediately upstream? This uses some old code I wrote some time ago to sum up total flows to date at a gage, to allow year-to-year comparison during the year. I colored this year, and all previous years that were worse, in red. By this measure, 2025 is the driest year since 1964.
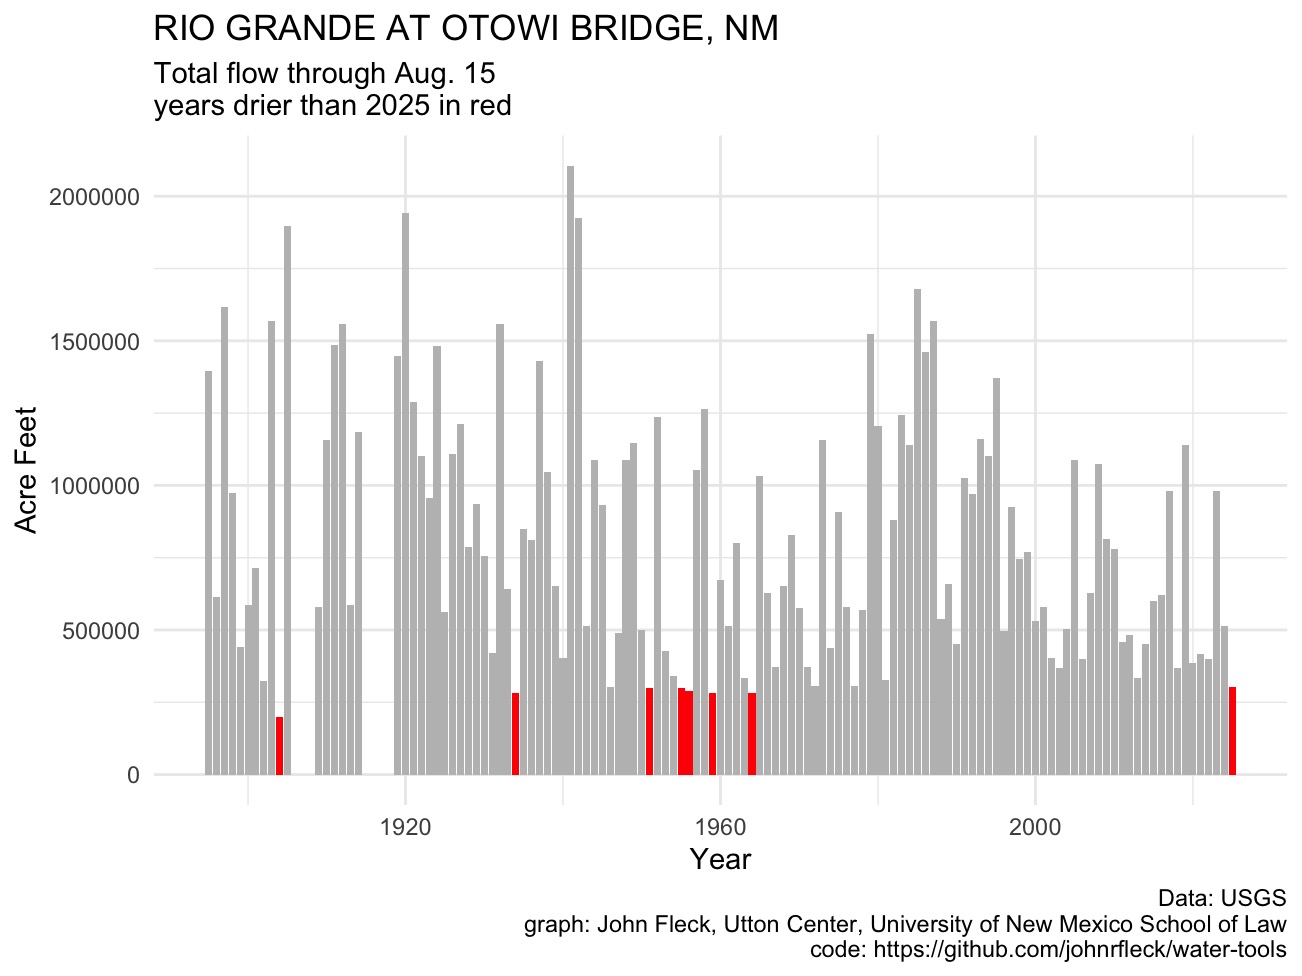
Total flow to date past Otowi.
08/16/’25 Today’s WSJ, p. A3 has a short piece “Water Source Dwindles in the West,” an AP article that is some boilerplate related to shortages and pending (again), projected cuts for the River basin and its peoples. Will attempt to paste the article:
Water Source Dwindles in the West
DENVER—Arizona, Nevada and Mexico will live with less water from the Colorado River again next year as drought lingers in the West, federal officials said Friday. The Colorado River, (seen left, as it flows through Ari-zona,) is a critical lifeline to seven U.S. states, 30 Native American tribes, and two Mexican states. The cuts are
based on projections for levels at federal reservoirs—chief among them Lake Powell and Lake Mead—released
every August by the U.S. Bureau of Reclamation. Arizona will again go without 18% of its total Colorado
River allocation, while Mexico loses 5%. The reduction for Nevada—which receives far less water than Arizona, California or Mexico—will stay at 7%. California won’t face any cuts because it has senior water rights and is the last to lose in times of shortage. Decades of overuse and the effects of long-term drought worsened by climate change means there is far more demand for water than what actually flows through the river. Low reservoir levels at Lake Mead have triggered mandatory cutbacks every year since 2022, with the deepest cuts in 2023.
Meanwhile, the states are working to reach agreement by next year on new long-term rules to govern the river
in dry years. The Trump administration gave a mid-November deadline for states to reach a preliminary agree-
ment, or risk federal intervention. Negotiations have faced delays as states push back against how much water they should each give up. The original 1922 Colorado River Compact was calculated based on an amount of
water that doesn’t exist in today’s climate. That leaves the Upper Basin states of New Mexico, Colorado, Wyoming and Utah to share far less water after the required amount is sent to the to the “Lower Basin” states of Nevada, Arizona and California. A large amount of water also is lost to evaporation and leaky infrastructure.
—Associated Press
My first thought upon looking at the Otowi Bridge chart: not much has changed since the Rio Grande has had similar low flows in the past. My second thought: most of those low flows came before the San Juan / Chama project came-line. This current low flow is the first since that project came on-line. Does this mean that the gains achieved by the SJ/Chama project have been entirely wiped up by climate change and increased usage upstream?
IIRC, the 1922 Colorado River Compact was calculated based on flow that didn’t even exist then, if one looked at long term averages.
That Otowi Bridge Crossing chart doesn’t surprise me. We have lived here since 2001 and I see mud flats under the bridge this year that I never saw before. It is really low.
Hi John, nice blogpost for a bad situation. Couple thoughts/suggestions for you. I suggest you modify the analysis to depict days when the daily average flow was less than 5cfs or 10 cfs. Nabil did that years ago and it was interesting. Arguably, the river was dry in multiple areas but using the USGS average for the day masked some of it. And, since the mid-1970s SJCP has been imported into the basin. It’s storage and release during dry times has masked the natural dryness since 1999 as well as the multiple compact released storage no release agreements NM negotiated with Texas in the early 2000s.