New Mexico’s Dry Middle Rio Grande: More Data Visualizations

Graph showing days of river drying on New Mexico's middle Rio Grande, showing 2025 the driest since the 1970s.

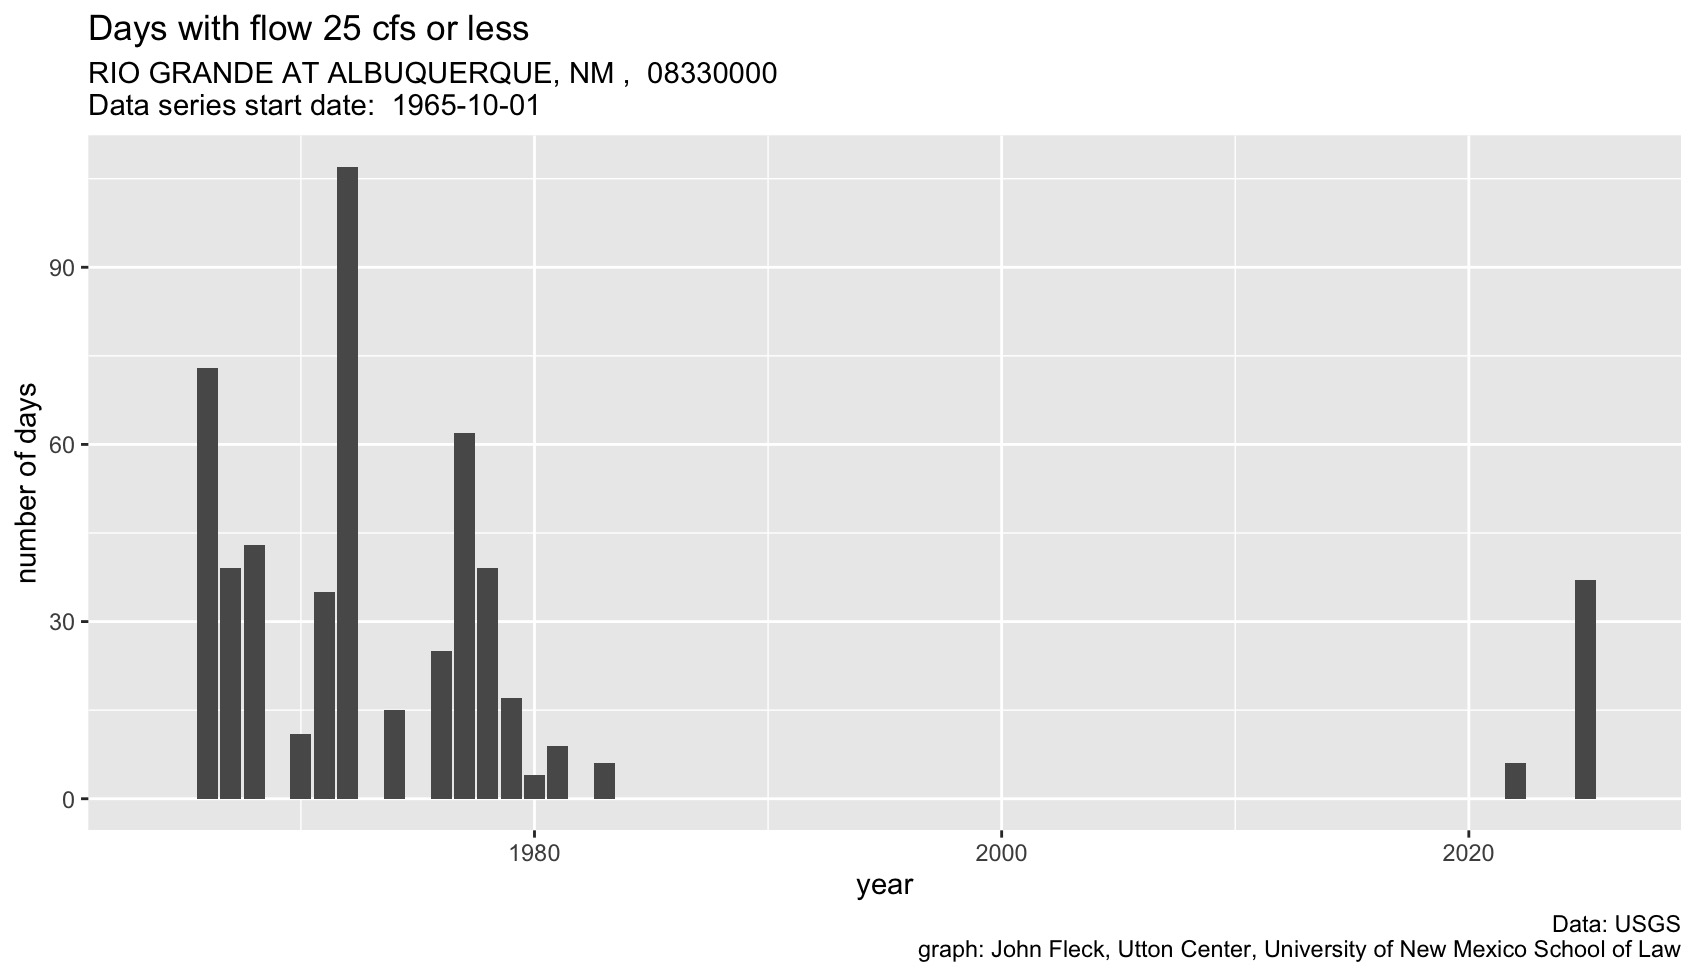
25 cfs at Central means the Rio Grande dries before it reaches the Albuquerque wastewater treatment plant.

Alert Inkstain reader Rolf asked in the comments of last weekend’s post for a version of the above graph – number of days of low flow at the Central Avenue Bridge – with a threshold above zero. I usually set the threshold at 25, because our experience in the last two drying episodes – 2022 and 2025 – that’s the point at which the river went dry before it could reach the wastewater treatment plant.

Bar chart of annual Rio Grande flow at Otowi Bridge, NM, from early 1900s to 2025, measured in acre-feet through August 21 each year. Each vertical bar shows a year’s flow; 2025 is near the low end. Years with less flow than 2025 are highlighted in red, showing rare but repeated low-flow events, especially in the 1950s and 1960s. Thick black horizontal bars mark decadal averages, which decline from the high flows of the early 20th century to lower averages in recent decades, illustrating a long-term downward trend.

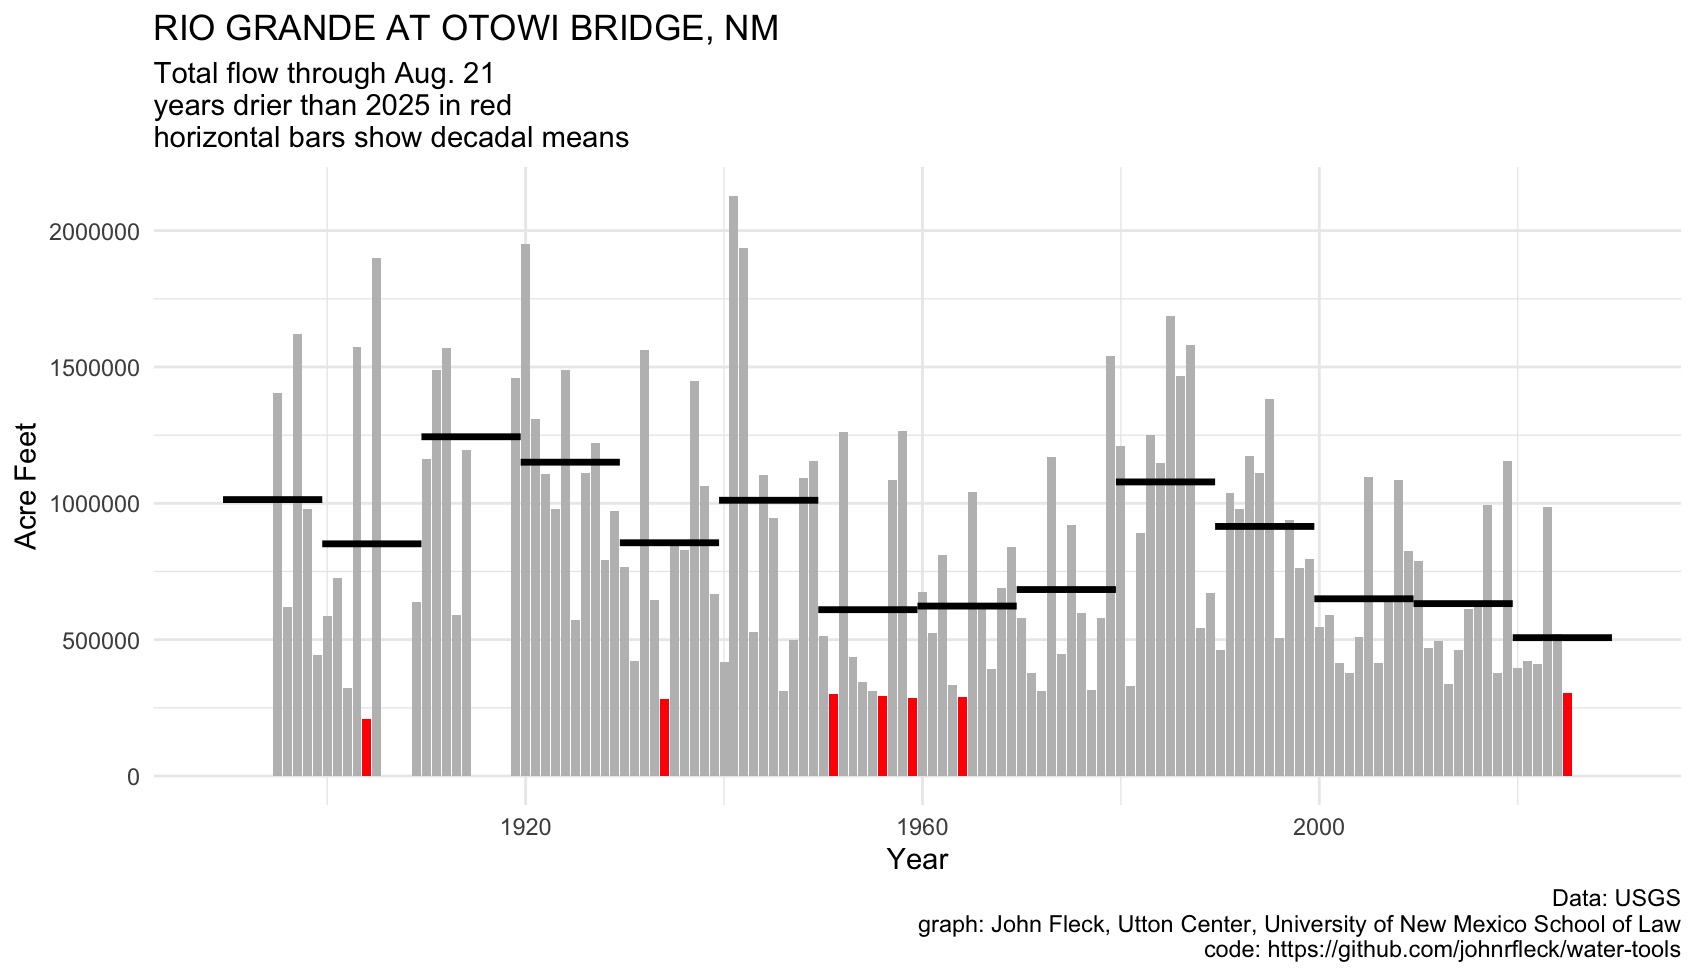
Previous years this dry or drier, with added decadal horizontal bars.

Here’s an updated version of total flow past Otowi to date, with previous years this dry or drier in red, and I added horizontal bars to show decadal averages. As alert reader Devin pointed out, the years after 1972 include imported San Juan-Chama flows. Rio Grande Compact accounting would subtract that out (“Otowi Index Flow”), but I’m interested in the hydrologic reality in the valley, not in using this as an accounting or climate measure. This helps us think about how much water we actually have entering the valley.

Bar chart of annual Rio Grande flow at Albuquerque, NM, from the 1960s to 2025, measured in acre-feet through August 21 each year. Each bar shows a year’s flow; 2025 is highlighted near the low end. Years with less flow than 2025 are in red, showing such low-flow events have been uncommon but not unprecedented. Thick black horizontal bars mark decadal averages, which rise into the 1980s and then decline steadily through recent decades, illustrating a long-term reduction in average flow.

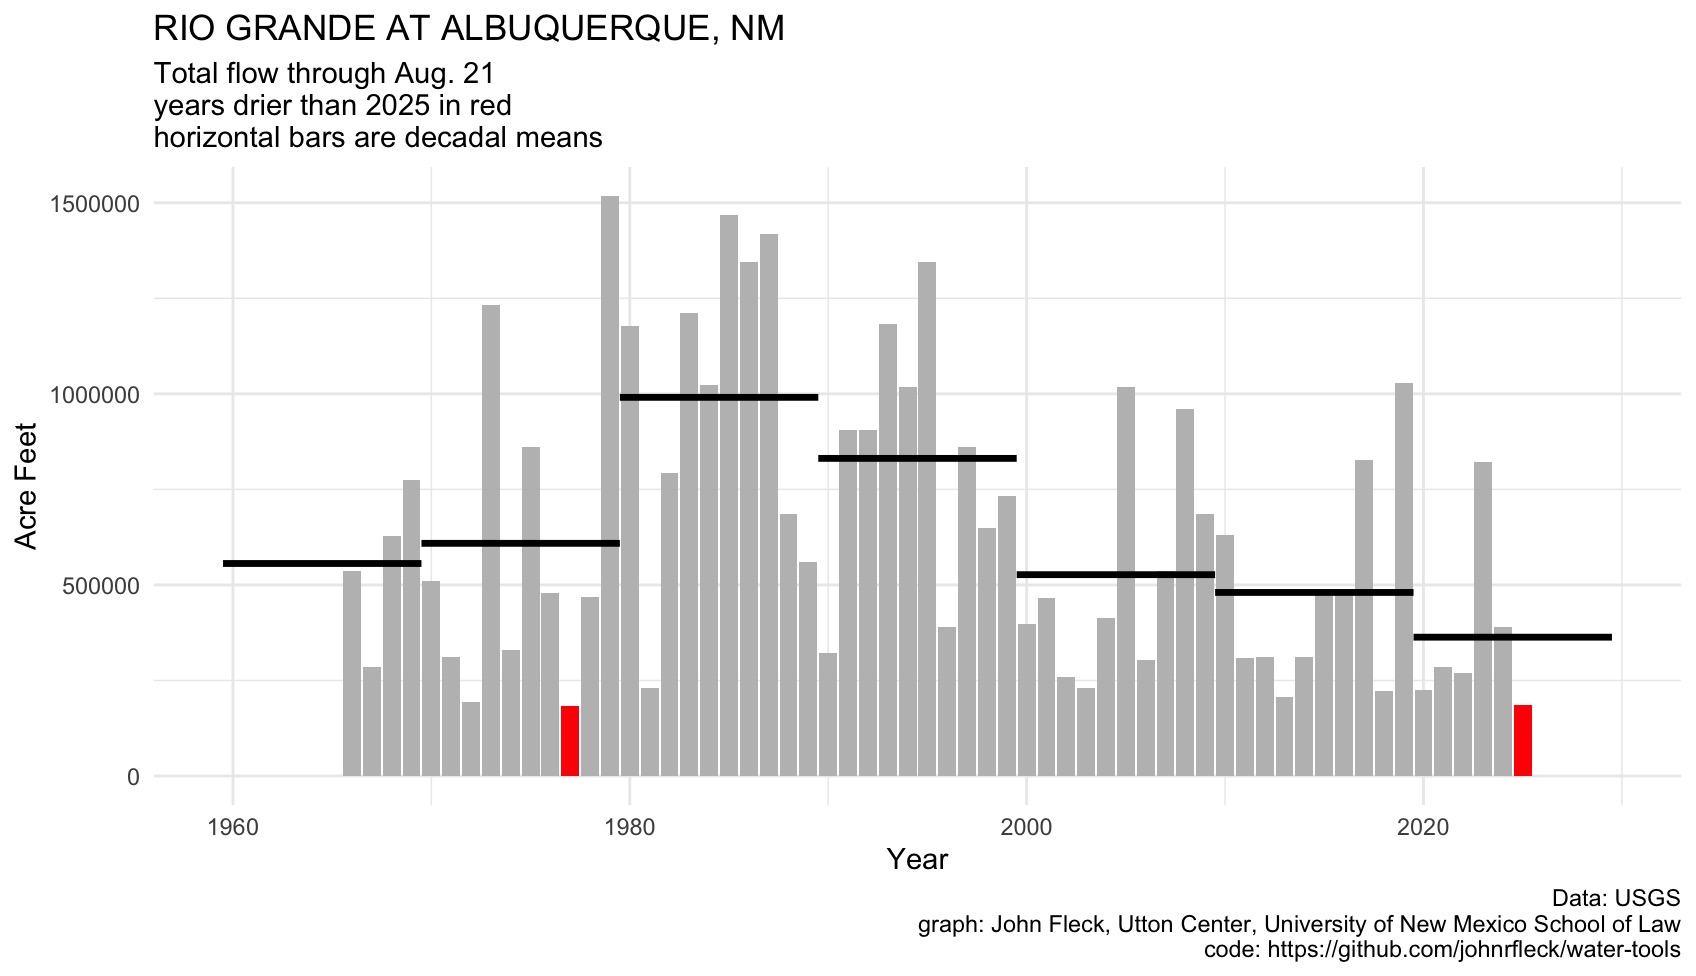
Total flow to date at Albuquerque gage.

Here’s the same approach as for Otowi above, but for Albuquerque. As measured by total flow to date, this is also the lowest since 1977.

And since it keeps showing up, here’s 1977. Worth noting (but hard to parse in too much detail because of some missing data) is that El Vado Reservoir began 1977 at near-normal levels, and even though it was a terrible snowpack year they were able to supplement flows by some 100,000 acre feet by draining El Vado between late April and early August of ’77 to supplement the Rio Grande’s flow:

Line and shaded-area chart of daily Rio Grande flows at Albuquerque, NM, 1965–2025. Shaded blue and green bands show historical ranges and medians. The 1977 line (black) shows lower-than-normal flows through winter and spring, but with sharp spikes during the summer monsoon. The 2025 line (blue) stays consistently low with no strong runoff or monsoon surge. The record median (green dashed) shows a strong May–June peak, absent in both 1977 and 2025.

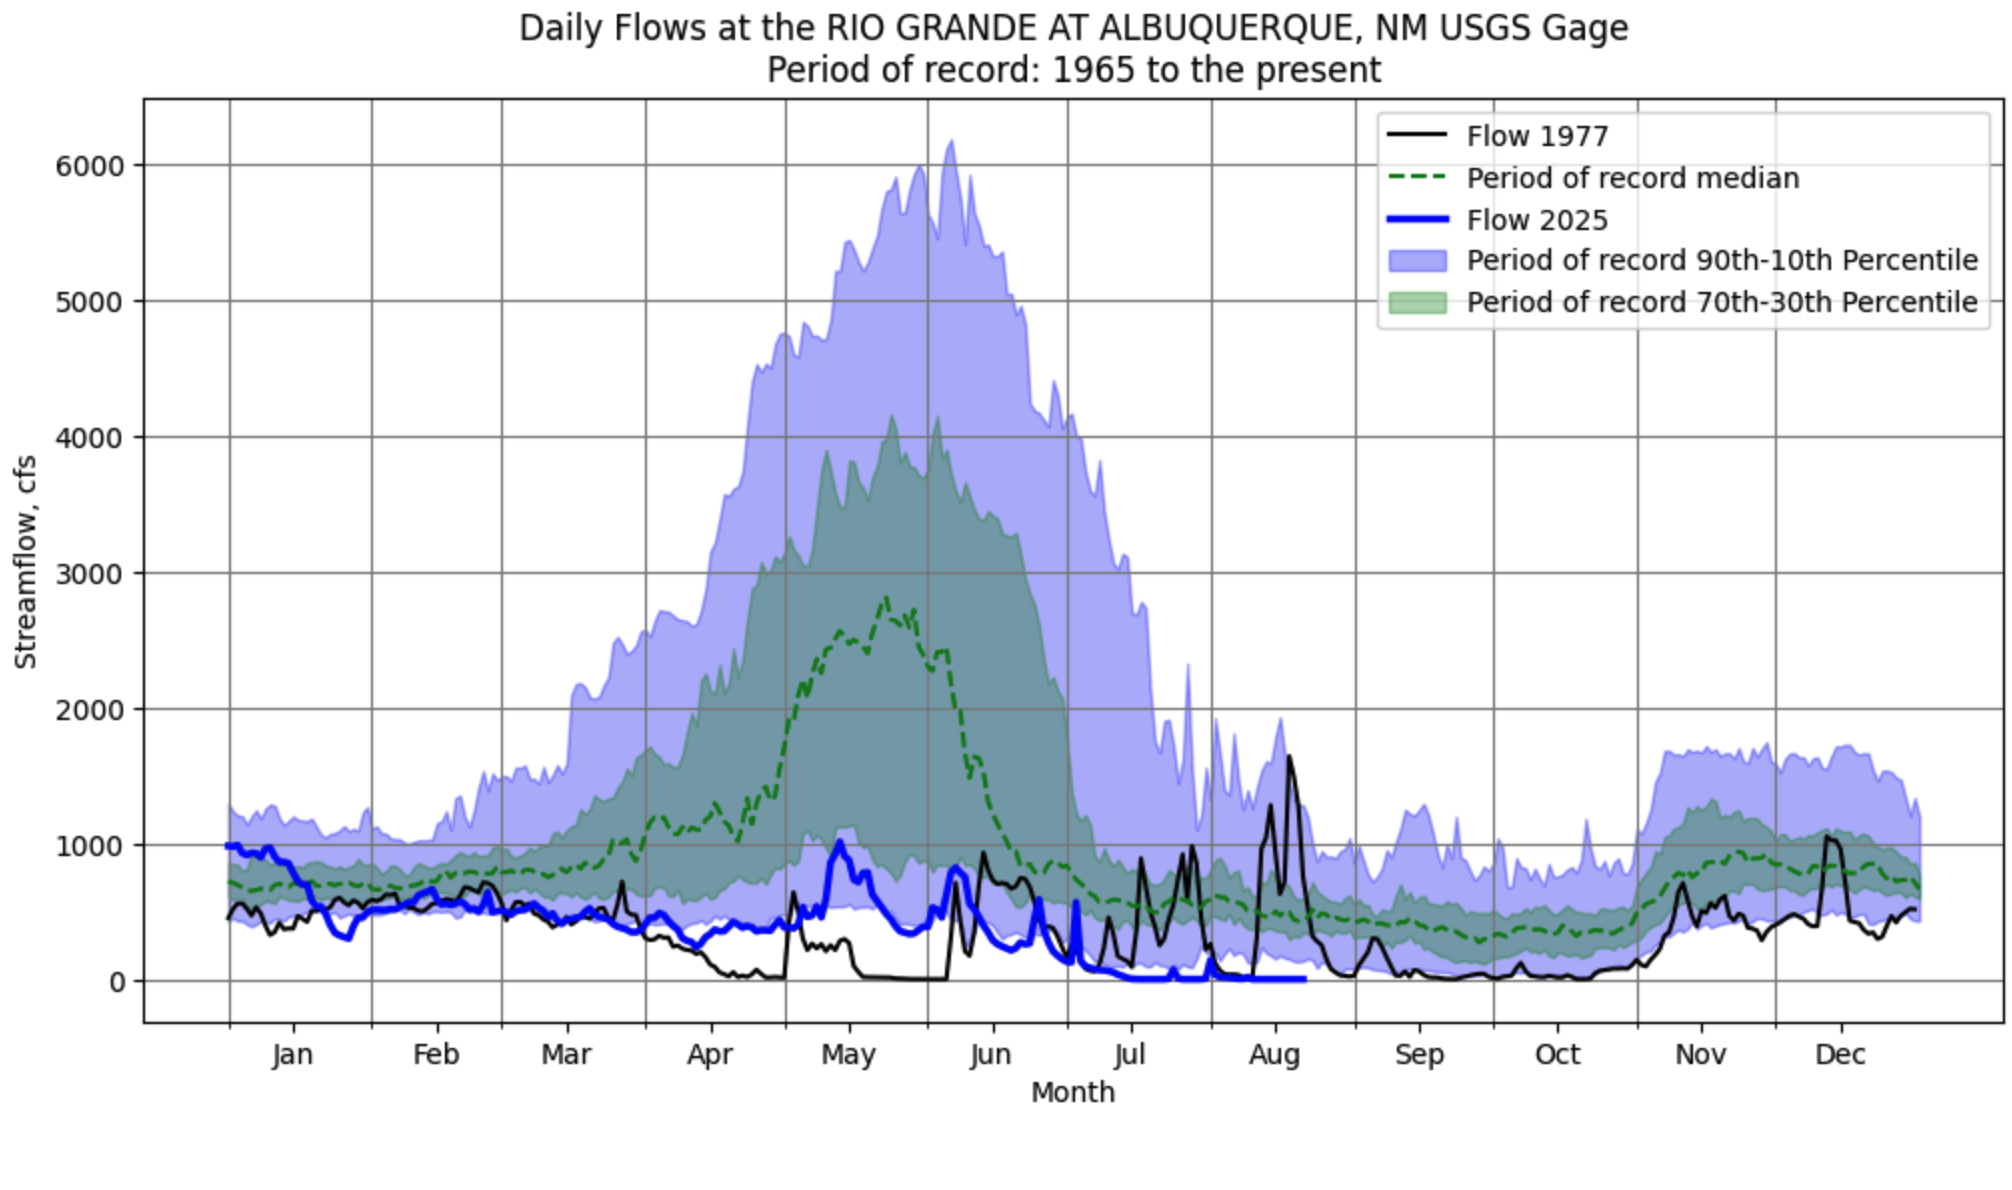
1977: drier spring, wetter summer.

Leave a Reply

Your email address will not be published. Required fields are marked *