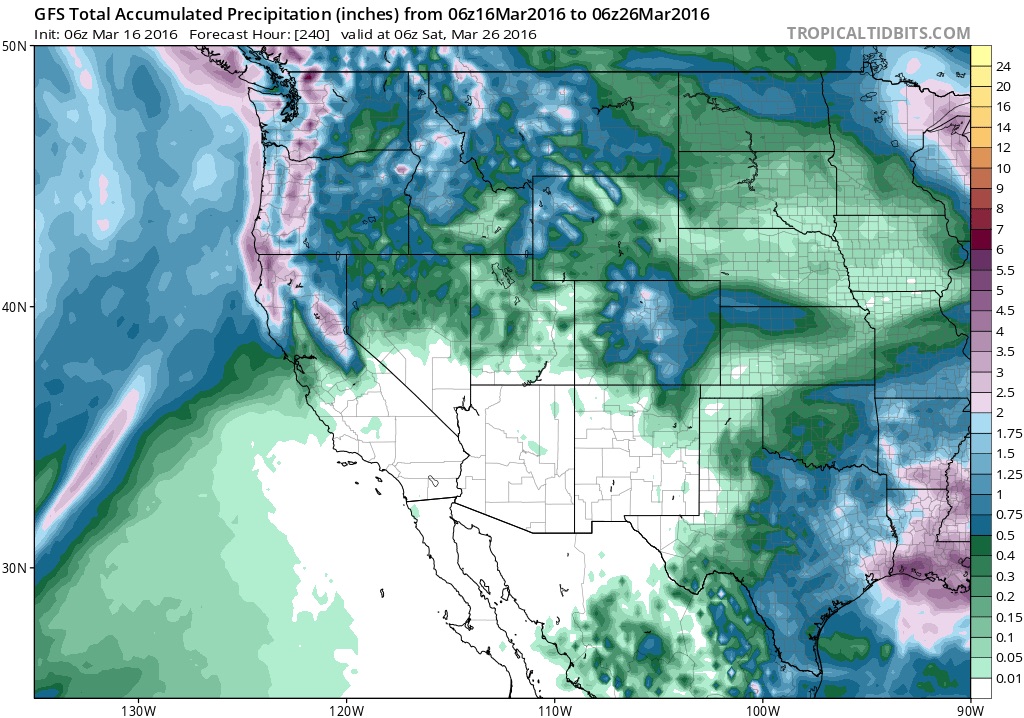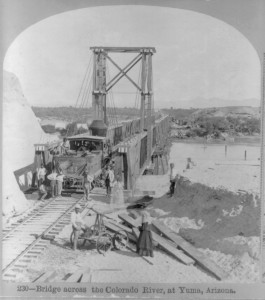
E. Conklin, Bridge across the Colorado River, at Yuma, Ariz., 1877, courtesy Library of Congress
There’s no way to pin down the moment I started working on my book, because it happened in fits and starts that extend back in one form or another for more than a decade. But the first time I really went all in was in the spring of 2010, when I made a trip down to Yuma and then up the Colorado River over several days to Las Vegas. It was the first time I went beyond just saying I was working on a book and actually spent money on fast food and cheap motels.
There was still sunlight left when I dumped my stuff at the motel, so I did what I always do, wherever I go. I went down to the river. Below and to the right of where this old railroad bridge used to cross the Colorado, the good folks of Yuma have built a fine city park, and on that April Sunday it was hopping. I got the last space in the parking lot, most every picnic table was in use, the barbecue grills were fired up, there were tubers in the river.
I asked the first person I ran into whether there was a community festival or something going on. Why all the people? No festival, she told me. Just a nice Sunday at the river.
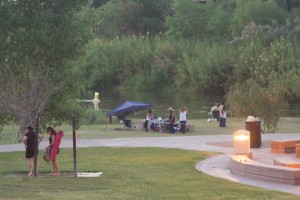
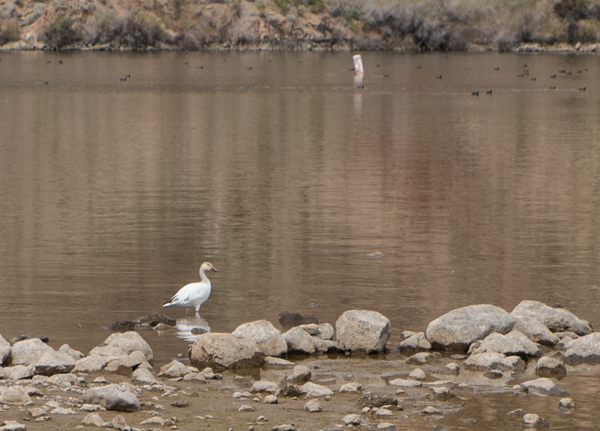
Easter parties on the Colorado River at Yuma, 2015
At that moment I bonded with Yuma, a community that in many ways for me captures the 21st century Colorado River. It’s a desert farm town, with all the dry and hot and poor that goes along with that. But more than any town as you head up the Colorado River until perhaps Moab in Utah, Yuma has embraced its river. Most of the West we built around the Colorado River has required moving water out of the Colorado River and using it elsewhere. And in fact Yuma does that too. Most of the Yuma County ag water is diverted 20 miles upriver at Imperial Dam. But Yuma emphatically remembers that it’s a river town. The network of canals that brings the water down is a marvel all its own.
But Yuma remembers the river at its heart, too. Last year I was there again on Easter, pulled in at dusk to the Hilton Garden Inn overlooking the park, and it was the same scene. The light was fading (it was darker than this picture looks, thank you Adobe photo modification products), but the people were still out at their river.
This is part of what motivates the project that my book turned into. I started the effort with a dismissive bias against desert agriculture. Does it make sense to grow alfalfa in the desert? By many measures, the water is more valuable in other uses. The economic benefits of urban water use dwarf those of desert agriculture, while at the same time environmental values press in from the other direction. But I’m unwilling to tell these folks, “Sorry, not enough water, we need it elsewhere.” I believe there is an alternative.
In the book I document three basic trends:
- farm communities like Yuma, growing their agricultural economies while using less water
- cities like Los Angeles and Las Vegas, growing their economies while using less water
- the growth of institutions needed to capitalize on those trends and develop the next level of water allocation and sharing rules to thread the needle left us by drought and climate change
There’s a fourth trend that’s not so clear, but about which I choose to be optimistic – a shift toward returning some water for the environment. In the book, I lay out an argument for how the institutions of that third bullet can leverage the first two. I am optimistic. I think we can do this.
I sent off the final copy-edited version of the book to the fine folks at Island Press this afternoon. There’s still one more wave of editing to come, proofing galleys in a couple of months. On the shelves, I hope, by September. Dying to share it with y’all. Soon.