The Farmers Almanac Says We’re Gonna Have a Wet Summer

Full irrigation ditch surrounded by green trees, flanked by a dirt path

With enough infrastructure, all droughts are shallow?

Seen on the bike

Monsoon forecast

The Barelas (aka “Little Ditch”) was running when I rode up to its heading this morning. Hardly ever see that. It’s a favorite. Guy walking his dog told me the Farmers Almanac says we’re gonna have a wet summer. Epistemologically solid.

Trespassing

A lady weeding in her front yard explained that I should just ignore the ginormous “PRIVATE PROPERTY” sign at the end of the street to cut through to get to the Duranes Lateral. Just be sure to close the gate, she said. Local norms FTW.

Mariachi

Technically not on the ride, but on the drive home, past the cemetery on Edith with the windows rolled down on a lovely spring morning, heard a mariachi band playing at a funeral. Local norms FTW.

Quoting Matt Webb

Incidentally GTA6 is coming out in November and apparently it cost $1 billion to make.

Gonna play the heck out of it not just for the music but because of its status as a cultural artefact: the final big game built before LLMs.

No-one will ever invest that much in a game again, no software will ever encode this quantity of hands-on human labour again. The last of the great pyramids.

Matt Webb

June 2, Bookworks

Writing the Wild: John Fleck, Ribbons of Green: The Rio Grande and the Making of Modern Albuquerque. Date: Tue, 6/2/2026. Time: 6:00pm. Place: Bookworks on Rio Grande, Albuquerque, 4022 Rio Grande Blvd NW, Albuquerque, NM 87107-3100.

I’d be delighted if you could join us June 2 at Bookworks

Smiling man holds a copy of a book entitled "Ribbons of Green," standing in front of a log pole fence.

In which I hold our book in my hands. Photo by L. Heineman

I was sitting on the front porch early this afternoon with my eyes on the street when the postman come up the front walk holding a book-shaped package. I walked up to him, reached out, and held it in my hands.

The kind folks at Bookworks and the Leopold Writing Program, with some help from UNM Press, have arranged a book launch event June 2.

I could not have dreamed of a better place than Bookworks to launch Ribbons of Green into the world, for two reasons. First, Bookworks remains a canonical bookstore. Second and more important for our book, it sits at the heart of one of the most important neighborhoods in Albuquerque for the narrative of our book. It was here, just around the corner on the Griegos lateral, that we imagine a young Max Gutierrez standing on the ditchbank watching flood waters finally claim the old village of Los Ranchos.

Just down the road is Max’s old farm, now home to Valley High School. His parents and brothers and in-laws had property scattered all through Los Griegos and Los Candelarias, and the evolution of these neighborhoods, from acequia villages to modern peri-urban suburbs of a growing.

Just up the road is Melquiades Montaño’s old farm, once a swamp, now a treasured community open space (Los Poblanos Open Space) farmed in alfalfa. Tracing a line from there down through Max’s neighborhood, just 550 feet east of Bookworks, is the Griegos Drain, built in the early 1930s to drain the valley’s swamps, changing the flood plain on which we built our city forever. We’re pretty sure Max’s father-in-law’s house is one of the properties condemned by the Middle Rio Grande Conservancy District because it was in the path of the drain.

One of the challenges in book like Bob and I have tried to write with Ribbons of Green is the movement back and forth from the general – the broad conceptual superstructure of the project – to the specific – the lives of people like Max and the places they called home. The boundaries between what Bob wrote and what I wrote in this book are opaque even to me, but I feel like the chapter about Max and, by inclusion, this neighborhood, may be the best thing I’ve ever written. (I’ll let Bob speak for himself.)


The Utility of Operationally Neutral and Flexible Conservation Pools in the Colorado River Basin

Nota bene: A guest post from friends of Inkstain John Berggren and Kevin Wheeler

John Berggren (Regional Policy Manager, Western Resource Advocates)

Kevin Wheeler (Principle, Water Balance Consulting)

5/5/2026

As everyone is well aware, the snowpack and associated runoff this year are truly awful. It will be one of the worst, if not worst, on record. The Bureau of Reclamation is using unprecedented policy levers to keep Lake Powell from reaching levels so low that the safety of the dam may come into question. And it is unclear if those policy levers will be enough, especially if the rest of the spring and summer are warm and dry. This got us thinking—are there other tools in the toolbox we are not considering?

While current guidelines may not contain much else, you only have to look as far as Reclamation’s Post-2026 Draft Environmental Impact Statement to see there are options being proposed. We explore how one of those—flexible and operationally neutral conservation pools—can actually provide system protection without the political, legal, and hydrological risk that comes with currently available options. The current Intentionally Created Surplus program in the Lower Basin is an excellent framework to explore how conserved water can be creatively moved between reservoirs, wherever it is needed most.

No need for new infrastructure, complicated agreements, or shifting of risk—just smart reservoir accounting and operations. We hope this level of flexibility and creativity is being considered in new Post-2026 Guidelines and in the Basin State’s negotiations.

Water Year 2026 Challenges

The Bureau of Reclamation’s April 24-month study indicates that under the ‘most probable’ scenario, Lake Powell will fall below 3,500 ft by August of this year if no further action is taken. Reclamation has indicated, however, they intend to plan for the ‘minimum probable’ scenario which has the reservoir crossing this critical threshold in July. In response, Reclamation will be releasing additional water from the Upper Initial Units (UIU) under the 2019 Drought Response Operations Agreement (DROA) in the range of 660 kaf to 1 maf. Reclamation has indicated these releases would come from Flaming Gorge and will help keep Lake Powell from dropping to critical levels.

Concurrently, Reclamation has announced they intend to reduce Lake Powell releases from 7.48 maf to 6 maf during Water Year 2026 under Section 6E of the 2024 Record of Decision from the Supplemental Environmental Impact Statement to the 2007 Interim Guidelines (SEIS). Reducing Powell releases has implications for elevations in Lake Mead as well as significant Compact implications. In the absence of any operational adaptations, the 10-year cumulative flow at Lee Ferry will fall to 82.7 maf by the end of the current water year. If releases are reduced to 6 maf and 1.48 maf of water is withheld in Lake Powell between April and September 2026, as is currently planned, the 10-year cumulative flow will be approximately 81.2 maf (Figure 1). This would risk triggering legal action by the Lower Basin.

Figure 1. Lee Ferry Cumulative 10-year Flow. The blue line shows the estimated decline of the cumulative 10-year Lee Ferry flow before any adjustments and the orange line shows an accelerated decline following a 1.48 maf reduction to Lake Powell releases made under 6E SEIS authorities.

Despite this immediate legal risk, Reclamation’s modeling demonstrates that both mechanisms will be required to protect Lake Powell this year, but just barely. Under ‘minimum probable’ hydrology, these actions would still result in Lake Powell dropping to 3,500 ft —dangerously close the hydropower intakes.

The Upper Basin has reluctantly accepted the proposed DROA releases which will significantly impact Flaming Gorge, but harbors significant concerns over whether water releases from the UIUs will be used to benefit the Lower Basin and how storage of the UIU reservoirs will be recovered. Similarly, the Lower Basin has issues with the reduction of Lake Powell releases to 6 maf, citing concerns over violations of the Compact and suggesting that more water should be released from the UIUs. Neither Basin is happy with Reclamation’s response to the dire hydrology this water year.

How could Water Year 2026 have been different?

The challenges discussed above present an opportunity to examine exactly how a primary tool developed for several of the alternatives in the Post-2026 Draft Environmental Impact Statement (DEIS) — operationally neutral and flexible conservation pools — could provide another means to handle extremely dry years. While current guidelines do not allow for this flexibility, Water Year 2026 does provide a concrete example for how moving conservation pool water could mitigate low runoff years and protect critical infrastructure without many of the challenges discussed above. In this hypothetical, we demonstrate how if conserved water currently stored in Lake Mead were to be treated as an operationally neutral conservation pool with flexibility in where it is located, Reclamation could more easily protect Lake Powell.

As of EOY 2024 (the most recent Reclamation Colorado River Accounting and Water User Report), there was 3.32 maf of conserved water, called Intentionally Created Surplus (ICS), being stored in Lake Mead. If this current conserved volume would be considered operationally neutral, as in some of the proposals in the DEIS alternatives, then Reclamation could move a portion of this conserved water up to Lake Powell. ICS water can be “moved” to Lake Powell by reducing releases from Glen Canyon Dam. Importantly, though, these reductions in Powell releases would not occur under the 2024 SEIS 6E authority and therefore would have no impact on Compact compliance.

In the current case, the proposed 1.48 maf reduction of releases from Lake Powell could be considered a transfer of ICS water from Lake Mead to Lake Powell. The reduction of releases would be added to the physical volume crossing the Lee Ferry Compact point, as though 7.48 maf were released from Powell, even though only 6 maf were physically released, so there would be no risk of a compact violation. That water would help to prevent Lake Powell from reaching critical elevation levels but would remain under the ownership of the Lower Basin contributors. Similarly, instead of needing to release 1 maf from Flaming Gorge, Reclamation could release only 500 kaf from the UIUs as part of DROA, and move an additional 500 kaf of ICS water up to Lake Powell by making a physical release of 5.5 maf for Water Year 2026 from Lake Powell (again, as though 7.48 maf were released). This would keep more water in Flaming Gorge which serves as a potential buffer if Water Year 2027 is similarly dry.

Figure 2. Options for Protecting the Elevation of Lake Powell. Under the minimum probable hydrologic condition from the April 24-month study, the orange line shows combinations of contributions from Upper Initial Units (UIUs) and Water Year 2026 releases from Lake Powell to maintain 3,500 ft elevation. The blue line shows the resulting minimum elevation of Lake Mead during Water Year 2026 on the right axis.

As shown in Figure 2, several options exist to maintain Lake Powell at 3,500 ft during the projected lowest month of March 2027. The options towards the left side of the graph indicate lower releases from UIUs and reduced releases from Lake Powell (i.e. increases in release reductions relative to the initially assumed release of 7.48 maf). The options on the right side of the graph rely on larger contributions from UIUs and greater releases from Lake Powell (i.e., smaller release reductions).

What if additional water is needed later in Water Year 2026?

Concerningly, the minimum probable hydrology is not the worst-case scenario and therefore additional flexibility may be required. The April to July runoff of Water Year 2026 is tracking very closely to Water Year 2002, which then resulted in the historically lowest inflow to Lake Powell. With the starting elevation today over 120 ft lower than it was in 2002, such a sharp decline would have far worse implications for Lake Powell. Using both levers to the extent currently planned may not be enough to keep Lake Powell at a safe elevation. Building upon the April 24-month study, if April to September inflow is equivalent to 2002, the “hole” in Lake Powell that Reclamation would need to fill might require an additional 530 kaf from currently projected volumes to maintain Lake Powell at 3,500 ft. To fill this hole, Reclamation may need to release additional water from the UIUs, but that presents significant physical risks because we cannot be certain what 2027 will be like and that would certainly face significant Upper Basin opposition. On the other hand, additional reductions from Lake Powell below 6.0 maf faces mounting legal risks, including exceeding Reclamation’s authorities under the SEIS and further exacerbating Compact concerns along with Lower Basin opposition. Having the flexibility to, again, pull from an operationally neutral conservation pool to respond to changing conditions and fill the inherently uncertain hole, provides a solution that avoids many of the legal, hydrologic, and political uncertainties.

What happens to Lake Mead?

The other benefit to having a flexible conservation pool is not just in the short term to move water up to protect Powell, but in the medium term as it provides the mechanism to move that water back down in future years. The water might have been needed in Water Year 2026 to protect Powell, but in Water Year 2027 it could be moved back down to Mead, depending on system conditions and priorities. Reducing Powell releases under Reclamation’s 6E authority provides no similar mechanism to recover that water in Mead in future years.

What if Water Year 2027 is dry?

In the absence of institutional barriers, prudent extended drought management operations in a generalized multi-reservoir context suggest keeping as much water as possible higher in the system, bringing water down only when it is needed. This approach keeps more options open for unknown future conditions. Furthermore, it minimizes evaporative losses due to cooler temperatures at higher elevations. In the context of the current Colorado River crisis, this would equate to minimizing additional releases from the UIUs while maximizing the use of adaptions to releases from Lake Powell, but only to the extent possible without impairing the operations of Lake Mead. If this mechanism were possible, more water could be retained in the UIUs while less water is released from Lake Powell. This approach increases the overall system protection if Water Year 2027 were to be dry.

“Birding Toward Hope”

Tucker Davidson of Audubon wrote a lovely piece about slowing down and listening to, and looking for, the birds:

Birding requires us to be present in the moment. It also allows us to shift our focus from our own worries and ruminations to another subject, breaking anxious thought patterns. Birds hold our attention without overwhelming it. For the socially awkward like myself, birding can provide deep enrichment without the anxiety-inducing obligation of socializing.

Rin and I had a blast last month talking about all this with Tucker on our Water Matters podcast.

Quoting Sonya Ziaja

Think of law as software. State agency budgets and staff are hardware. We have been stripping the copper for the past forty years, making software updates questionably useful, without durable fixes to the hardware. For constitutional environmental rights to make a difference, state natural resource departments need to be adequately funded and staffed.


– Sonya Ziaja, University of Baltimore School of Law, from an excellent new empirically grounded paper on the disconnect between environmental and natural resource laws as they are written and their real impacts on the ground.

Quoting Emily Drabinski on libraries

Often we are the only indoor public space in our communities and provide the only accessible public bathroom. We provide broadband internet to people who can’t access it otherwise, and assistance with the email addresses and online forms required to access public welfare programs. Extreme poverty, unaddressed mental illness, the opioid crisis?—?all of it walks through our doors and makes itself at home.

– Emily Drabinski, The Library is a Commons

Every Pixel Tells a Story

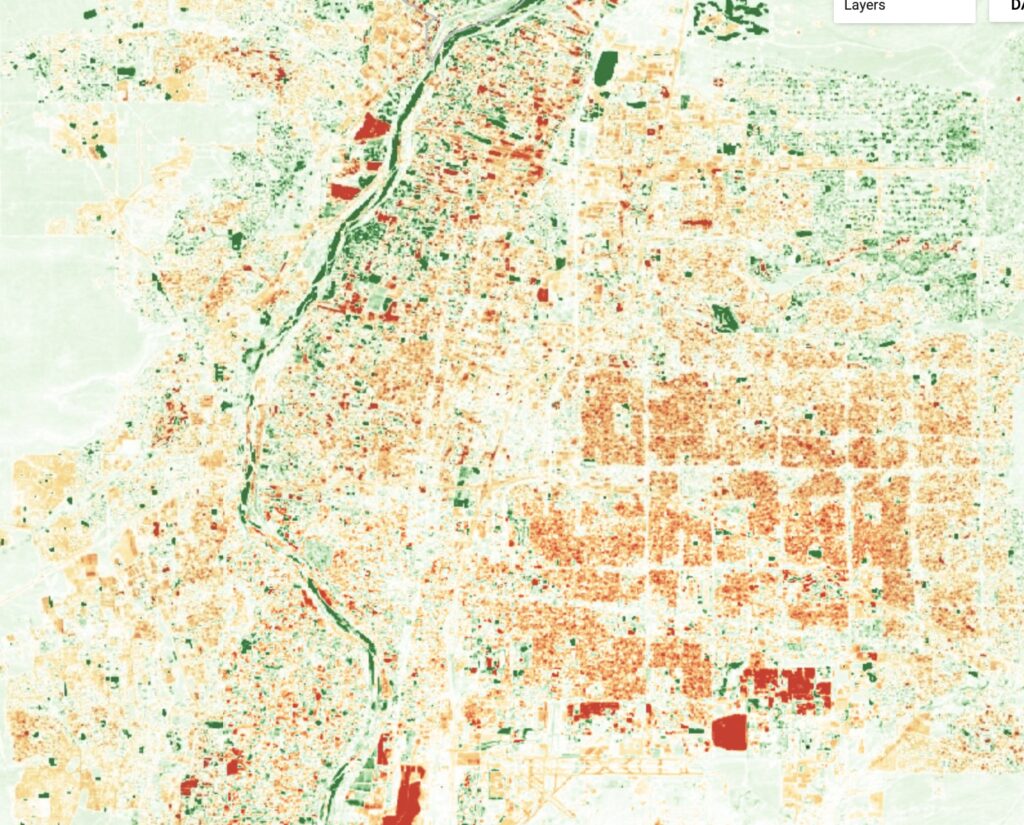
Screenshot of a Google Earth App showing red areas of Albuquerque where water use has gone down and blue where it has gone up.

Every pixel tells a story.

I’ve been learning over the last few months how to make better use of the cornucopia of remote sensing data, satellites flying overhead snapping our picture, Instagram writ large. It offers a helpful reframing of my thinking about how water is spread across the landscape of New Mexico’s Middle Rio Grande Valley.

Sometimes we do it with intentionality and purpose, turning a farm field into a shopping center, running municipal lines to a new neighborhood, or abandoning an old one. (Yes, the latter has happened.) Sometimes the landscape grabs water on its own, trees dipping their roots into the shallow aquifer on the valley floor. Sometimes we do it because we value the green. Sometimes the change in green is just a side effect, water stuff just happens. Sometimes the satellite data helps answer questions. Mostly right now, for me, it suggests new questions to which I don’t know the answers.

Consider the map above. I’ve been staring at it for the last week in QGIS, the mapping software on my laptop. I built a Google Earth Engine app so you can stare at it too.

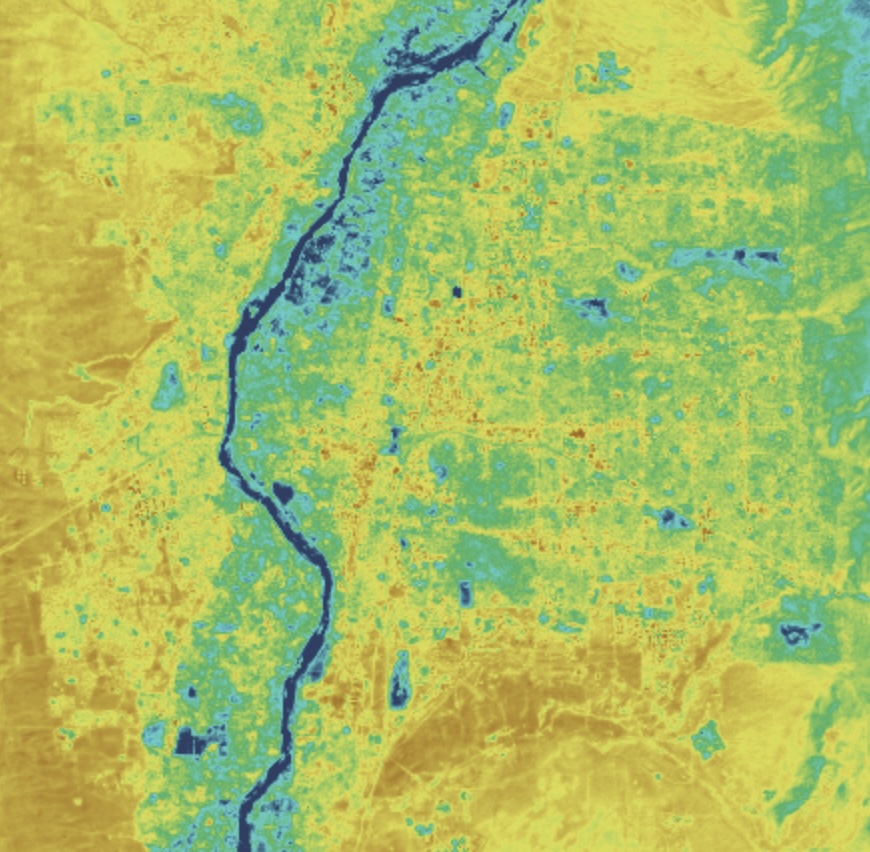
NASA’s Landsat satellites have been flying around snapping our pictures since the early ’70s, and with enough resolution beginning in the mid-’80s to begin seriously looking at the questions I’m interested in. The image above draws on algorithmic magic that creates an enhanced vegetation index showing which of the little pixels are vegetate – the thing we do with our consumptive use of water, making our desert landscape green. For the map above, I’ve colored each pixel to show the vegetation trend over time – blue ones have gotten more vegetated (by implication using more water), red ones have gotten less vegetated.

The map is full of “duh” moments – neighborhoods built since the 1980s are blue, as we turn desert into homes with trees and gardens, cars out front and kids’ basketball hoops in the cul-de-sacs. The former Kirtland Air Force neighborhoods along the northern edge of the base light up red. No more cul-de-sacs and basketball hoops, no more trees. The old farms of the South Valley that are no longer irrigated show up as big irregular red patches – Valle de Oro the most prominent, but the old Tobacco Farms property that’s now a Walmart, and the east side south valley farms that are now light industrial – red as well.

The riverside woods are largely greener, a riparian bosque flourishing after the combination of levees and an upstream flood control dam enabled our beloved forest to become what it is today. Except where it isn’t – the bits of red sprinkled through the bosque raise fresh questions.

The mix of blue and red on the valley floor tells a rich story – the expansion of the leafy village life of Corrales and Los Ranchos de Albuquerque as residents optimize around its mix of ditch water and unmetered domestic wells (and city water in Los Ranchos) while parcels farmed and irrigated decline. We’ve been looking at these patterns in bulk census data for years. The satellites let us see them, pixel by pixel, on the landscape.

Albuquerque’s near Northeast Heights, where I live, is fascinating. All that red! I could tell a simple just-so-story about municipal water conservation efforts that took hold in the mid-1990s, xeric gardens like mine. But it might be something as simple as a pattern of senescence of neighborhood trees build during the post-war boom of the 1950s. Maybe both? Tearing out lawns – the lawns from which they got water – dooming our aging trees?

There’s a big red pixel across the street from my house where our neighbor’s magnificent old cottonwood is no more.

There’s some sciency work going on behind all this, as my UNM colleagues and I turn toward bulk numbers and trends, trying to step away from the flattened landscape suggested by water agency numbers to the richer picture the remote sensing data offers of where the water is actually going in this coupled human-natural system, what we do with it, what we actually have reason to value.

But I also love the little stories. Every pixel tells a story.

A note on methods

The conceptual work – choice of methods, experimental design, iteration over various options of time periods, geographies, and remote sensing tools – is mine, with help from some of our smart students who have been teaching me about this remote sensing stuff for years. I use Anthropic’s Claude Code and OpenAI’s Codex for the software engineering. They are way better at writing code than I am. Most of the resulting code runs on Google Earth Engine, which supports my academic work with a generous free account.

In posting this publicly, a) I’m reasonably confident of what I’ve got, and b) I bear responsibility for the results.

More on 2026 US wheat acreage

Monochrome line chart of U.S. planted acreage for corn, soybeans, and wheat, 1919-2026. Wheat is the solid black line and declines over the long run to about 43.8 million acres in 2026; soybeans, shown as a dotted gray line, rise to about 84.7 million acres; corn, shown as a dashed light-gray line, remains highest at about 95.3 million acres.

The rise of soy.

It’s always more interesting than I think!

After this morning’s quickie “wheat acreage lowest since 1919” post, I dusted off my USDA NASS data skills (I used to work with that data a lot, but it’s been ages).

Why 1919?

1919, it turns out, was when USDA’s US wheat acreage record starts! So really what we’re saying is “the lowest acreage as far back as the data goes.” Wheat’s been in a long decline since the early ’80s.

What was happening in 1919?

US wheat acreage exploded during WWI because Europeans were using their farmland to kill one another rather than grow food, and we stepped in to fill the gap.

2026 is stuff happening at the margin

While “lowest since 1919” sounds dramatic (hence my clickbaity morning post), in fact the squiggles on the graph show stuff happening at the margin: wheat down a little bit, but enough for the clickbait, corn also down a little but, soy up a little bit.