The April 2021 24-Month Study was a Shocker, but is it too Optimistic?

By Eric Kuhn

The release of last week’s Bureau of Reclamation 24-month study felt like very bad news for the Colorado River (See Tony Davis for details.). But a careful reading of the numbers, and an understanding of the process through which they are developed, suggests things are likely even worse than the top-line numbers in the study.

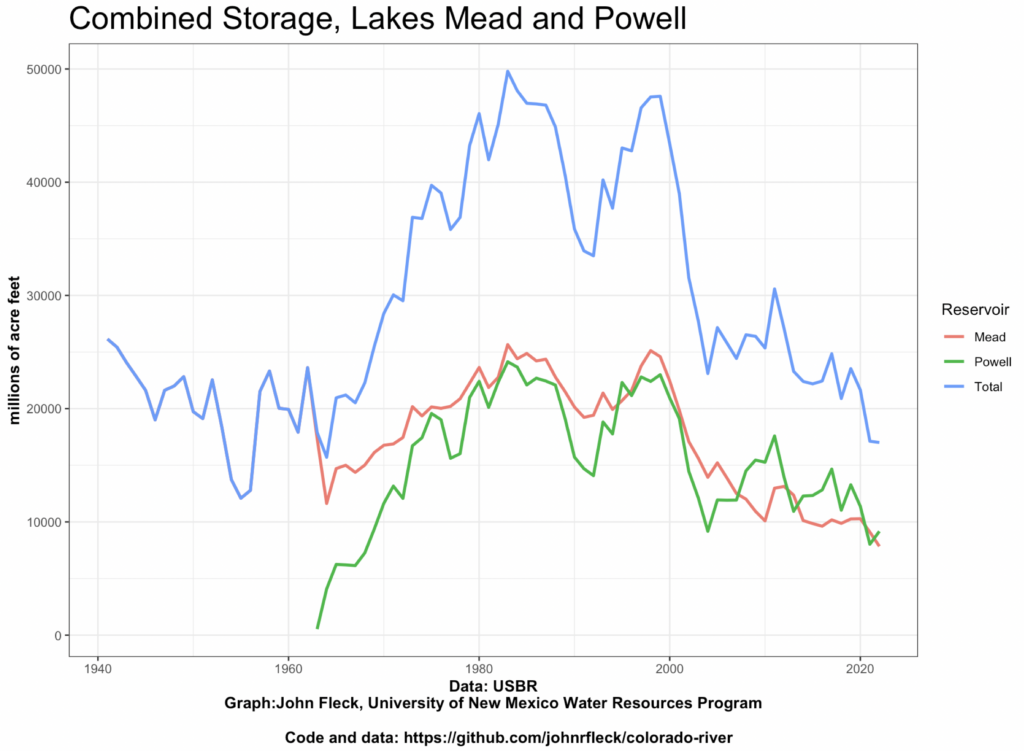
The problem: the assumptions underlying the study do not fully capture the climate-change driven aridification of the Colorado River Basin. Taking climate change into account, it is easy to find evidence lurking in the report to suggest that, in addition to problems for Lake Mead, Lake Powell could drop below elevation 3,525 in 2023, a level that is troublingly close to the elevation at which Glen Canyon Dam could no longer generate hydropower.

The 24-month studies are used to project out two years of monthly inflows, releases, storage levels, and power generation from the system’s large reservoirs in both basins as well as diversions by the large water users on the river below Lake Mead, especially the Central Arizona Project and the Metropolitan Water District of Southern California. Reclamation releases a “most probable” study on a monthly basis as well as “minimum probable” and “maximum probable” studies approximately quarterly. These studies are important because they are used to make critical decisions under the 2007 Interim Guidelines and both the Upper and Lower Basin Drought Contingency Plans (DCPs).

For the first year, Reclamation uses “unregulated” runoff forecasts generated by the Colorado Basin River Forecast Center (CBRFC) model. Unregulated inflow is not the same as natural inflow. The CBRFC does its best to adjust the forecasts for upstream diversions and for the many reservoirs that are not included in the 24-month study model. Inflow forecasts for the second year of the 24-month studies are not based on the CBRFC model. Instead, Reclamation, in consultation with CBRFC, uses statistics from the past and its judgment. Running the 24-month study model then simulates the operation of the upstream reservoirs such as Navajo, Blue Mesa, and Flaming Gorge, turning unregulated inflow to Powell into “regulated” inflow. For example, from the April ‘21 most probable study, the WY 2021 unregulated inflow to Powell is 4.897 MAF, regulated inflow is 4.908 MAF. These numbers are close, but in WY 2020 regulated inflow exceeded unregulated inflow by about 700,000 acre-feet.

The media buzz over the April 24-month study primarily focused on the projected Tier 1 shortage for the Lower Basin in 2022 – an event that is newsworthy, but one that also was totally expected. Perhaps more interesting and alarming is what the 24-month studies suggested for 2023. As pointed out by John in his recent blog, the most probable study shows two years of 7.48 MAF releases from Lake Powell, Lake Mead elevations on the cusp of a Tier 2 shortage in 2023, and by inference, Lake Mead dropping to a level of about 1035’ by the end September 2023, which by implication would trigger a third straight shortage year and California’s possible participation sharing shortages under the Lower Basin DCP.

For Lake Powell, the most alarming results come from the minimum probable study, not the most probable study. Under the minimum probable inflow forecast to Powell, which, in theory, represents an unregulated flow that would be exceeded in 90% of years, by March of 2023 Lake Powell drops well below the 3525’ target that would trigger supplemental releases from the upstream CRSP reservoirs under the Upper Basin DCP. There is also a real possibility that Lake Powell could end up in the Lower Elevation Balancing Tier. If this happens, the April minimum probable study shows that Lake Mead gets more water in the first six months of WY 2023 than under the most probable study.

The term “minimum probable” implies an outcome that is very unlikely to occur, therefore, why should we be that concerned? My answer is that given the abundance of recent science concluding that the Colorado River Basin is not in a classic drought, but rather, it is undergoing aridification where the flows seen in the last two to three decades may be the new abnormal and may continue to decline (see for example Overpeck and Udall, and the latest Utah State Future of the Colorado River white paper White Paper). The April studies show a most probable Powell unregulated inflow for WY 2022 of 9.998 MAF and a minimum probable inflow of 7.208 MAF. For comparison, the mean unregulated annual inflow to Lake Powell over the last ten years, including WY 2021, was only 8.04 MAF and five of the individual years; 2012, 2013, 2018, 2020, and 2021, were well below the 7.208 MAF. The average of those five dry years was 5.08 MAF, over two MAF less than the assumed minimum probable inflow for 2022. If you take the record back to 2000, the results are similar. In 11 of 22 years, unregulated inflow to Lake Powell was less than 7.2 MAF/year.

Based on the last 20-plus years and the recent science, I conclude that both the minimum probable and most probable 24-month study year two unregulated inflows to Lake Powell are overly optimistic. The likelihood that in the next few years Lake Powell storage will fall below the 3525’ target or even the minimum power elevation (3490’) and that Lake Mead storage will approach 1025’, the level that triggers the maximum annual cutbacks under the Interim Guidelines and DCP, about 1.4 MAF, is much greater than what is conveyed by these studies.

A few years ago, Reclamation made the decision to begin using a stress test (1988-2018) in addition to the full “natural flow” record (1906-2018) for planning and project evaluation purposes. It may now be time for Reclamation to do something similar with the 24-month studies – base the year two unregulated inflow to Lake Powell on the post-2000 hydrology. This would not change the first-year decisions based on the 24-month study, but would help people in the basin better understand second year risks.

Not drought

From my conversation last week with Drew Kann at CNN:

To Fleck, all of this signals that the reduced flows in recent years are likely not an aberration, but rather a glimpse of the challenges posed by a hotter, drier climate.
“We’re now seeing the model for what the future of Colorado River Basin water use looks like, where scarcity is the norm and drought is not some special short-term thing,” he said. “This is the way of life we’re in now with climate change reducing the flow on the river.”

Lake Mead likely to drop below elevation 1,040 by late 2023

Boulder Harbor, Lake Mead, Oct. 18, 2010

Boulder Harbor, Lake Mead, Oct. 18, 2010

I’m choosing my words carefully here. The “likely” in this blog’s post’s title means “based on my analysis of the Bureau of Reclamation’s current ‘most probable forecast’ Colorado River water supply model runs.”

The Bureau’s current “most probable” modeling suggests that in both 2022 and 2023, the annual release from Lake Powell will only be 7.48 million acre feet. This is based on a provision in the river’s operating rules that, under certain low storage level conditions, the Upper Basin gets to hang onto water in Powell.

The last time and only time we had a 7.48 release, in 2014, Mead dropped 25 feet in a single year. We’ve never had two consecutive 7.48 releases.

The headline in yesterday’s release of the Bureau of Reclamation’s “24-month study” (pdf here) is that Lake Mead will drop below elevation 1,075 at the start of 2022 (triggering a “Tier 1” shortage) and could drop below 1,050 by the start of 2023 (that’s the trigger for “Tier 2”).

Tier 1 next year, which primarily hits Arizona with some deep forced reductions, was no surprise. That’s been obvious for a while, and Arizona’s water leadership has been softening folks up for months. The increasing risk of Tier 2 in 2023, which would mean deeper cuts in Arizona, is sorta new, but it’s been foreseeable.

The real “holy shit” for me in yesterday’s release was the trail of breadcrumbs in the Bureau’s data, pointed out by my co-author Eric Kuhn, leading to a “most probable” Lake Mead drop to elevation 1,035 by the end of September 2023.

To be clear, the Bureau isn’t saying this yet. The latest 24-month study stops at the end of March 2023. But internally, the Bureau runs the model out farther in order to determine, among other things, how much water is likely to be released from Powell in 2023. And the published numbers clearly show – the Bureau’s “most likely” scenario would call for another 7.48 release.

From there, it’s just arithmetic. Based on my analysis of the publicly available numbers, the “most likely” scenario puts Mead at elevation ~1035 at the end of September 2023. This is my math, but my understanding is that it’s consistent with what the Bureau’s internal calculations show.

In my linguistic equivalence here between “likely” and “most probable forecast”, remember that I’m talking about the midpoint in a range of possible outcomes. A run of wet weather could make things substantially better.

But a run of dry weather could make them worse.

The tragedy of the anticommons – we’re good at saying “no”

Cleaning out some old files this morning, I ran across this great quote from Pat Mulroy some years back from a talk about the problems of the Sacramento-San Joaquin Delta. Via’s Maven’s Notebook:

We are very, very good at saying no. We are very, very good at blocking. Anybody can stop anything. What we can’t do or can’t seem to do is find a structure within which to say yes. You will never have enough science, you will never have enough data, but at some point, something has to change.

This applies beyond the California Bay-Delta.

Rio Grande so low I needed to switch to log scale

Flow so low I needed to switch to log scale

I mostly hate log scale in graphs I use for broad communication purposes. It’s just not intuitive.

But I’ve made the switch for this year’s Rio Grande, because the flows are so low that we need the log scale, because at really low flows small changes become big, if that makes any sense. The difference between 50 and 150 cubic feet per second through Albuquerque is hugely consequential for the our river. Best to have a visual display that highlights that.

Some data on a bad year on New Mexico’s Rio Grande

Total storage on New Mexico’s Upper Rio Grande reservoirs right now is the lowest it’s been at this point in the spring in over four decades of records

No sooner did my spring break begin a week ago (quite literally within a couple of hours of the end of my last class before break) than I got sick. This has led to much laying around, and resting, which I think was the point?

I’m finally on the mend, and a friend got me out of the house yesterday morning for a walk down by the river. Which was nice, except I have the sort of friends who have the latest Rio Grande gossip. Like about how we could see the river go dry by June, stuff like that.

Sigh.

Rio Grande at Albuquerque’s Central Avenue Bridge, March 19, 2021

To be honest, the river looks pretty good right now. There were a few buds to be seen, but mostly the river’s still wearing its winter colors, the quiet tans and browns that I’ve always thought were one of its best looks. With the gauge at the Central Avenue Bridge reading a bit less than 600 cubic feet per second, it was enough water to barely fill the channel from bank to bank, which as you can see from the picture also is a nice look. It’s only 25th percentile flow for this time of year, but not awful.

The awful is the thing we expect to come next.

The March 1 forecast called for 54 percent of the long term mean flow in the river into New Mexico’s “Middle Rio Grande Valley” – the part of the river where I live, the “Albuquerque reach”. That’s the mid-point, the one-in-ten best chance (90th percentile) is 93 percent of average, the one-in-ten worst (10th percentile) is 26 percent.

That’s bad, but the situation is made far worse by the graph at the top of the page. Mid-March total storage in the three upstream reservoirs was just 140,300 acre feet, which is just 29 percent of average and, more importantly, the worst in the dataset that I have access to, which goes back to 1980.

We’ve limped by in recent years by draining storage, keeping the river wet for the cultural and environmental benefits that provides, and keeping the irrigation ditches wet as well. That’s not going to be possible this year. That’s why my gossipy friend, who is connected, pointed to the possibility of river drying by June.

A note on data sources and methods: The data comes from the USBR Upper Colorado Region’s historical datasets, to be found here. I grabbed the data for Heron, Abiquiu, and El Vado reservoirs, summing up total storage for March 15 every year for which we had data on all three, which goes back to 1980. There’s probably longer datasets available somewhere, but I’m just an unpaid blogger with a few spare hours on a spring weekend, so you get what you pay for, eh?