Was prior appropriation really about distributive justice?

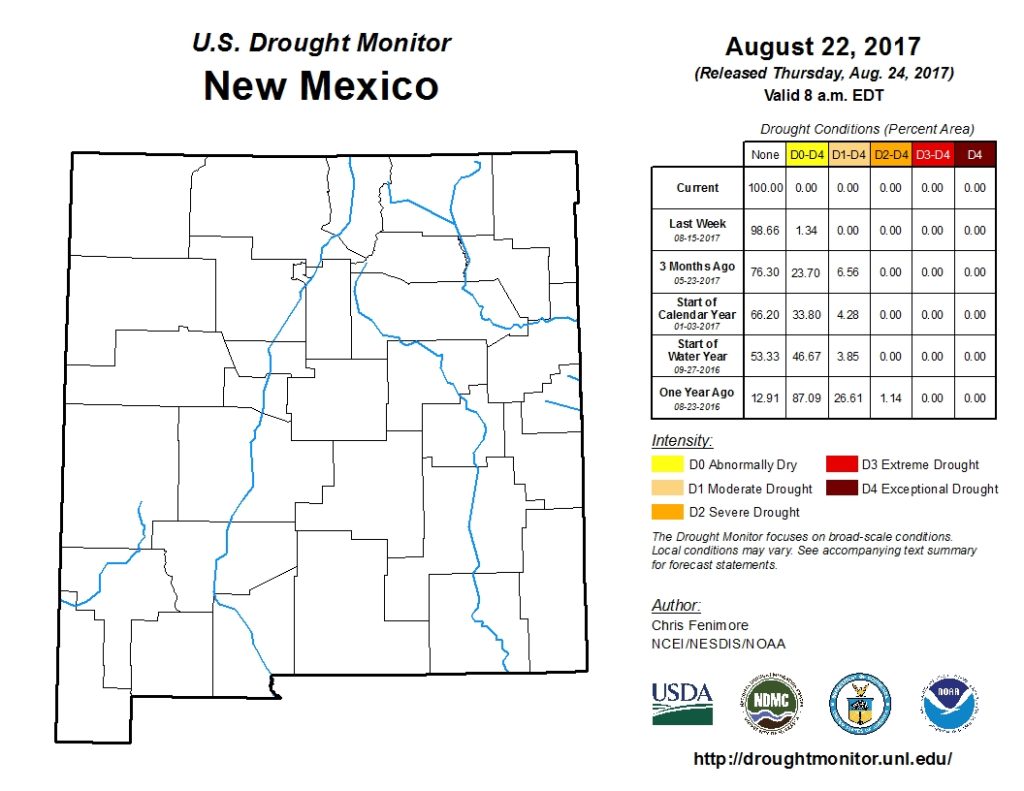
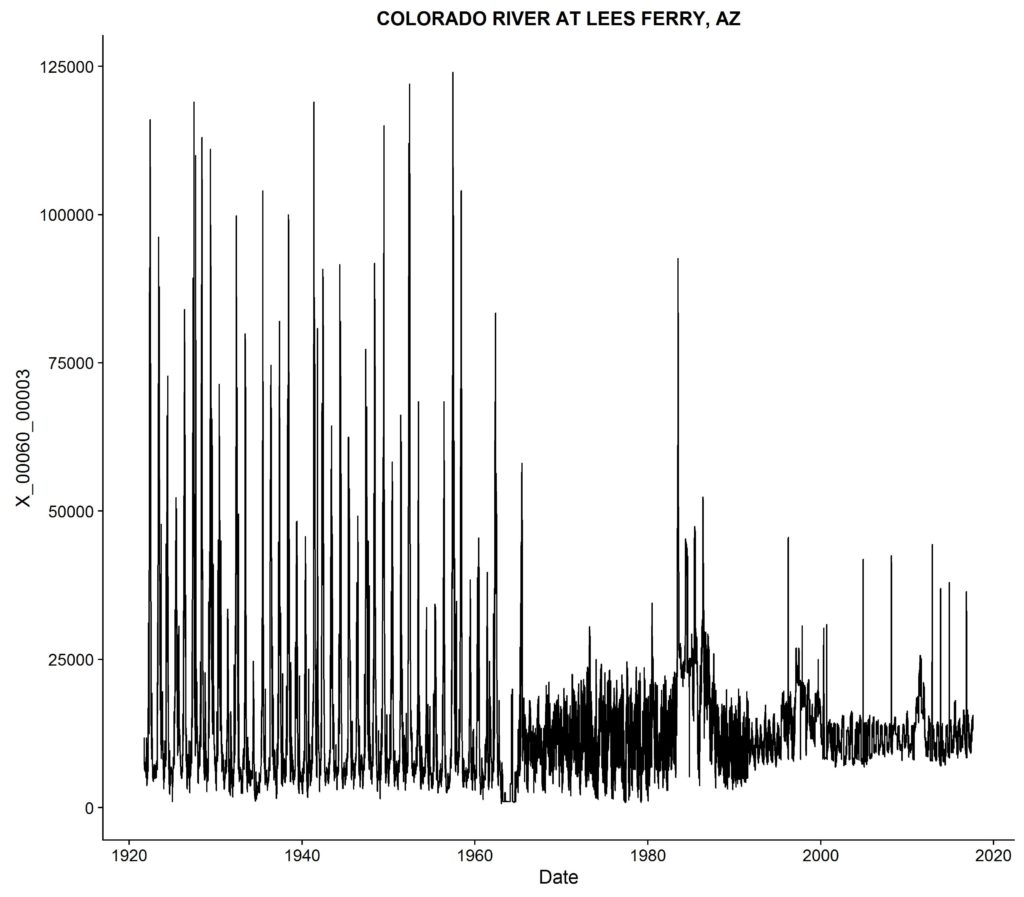
From Jill Robbie at the University of Glasgow, a nice explanation of David Schorr’s revisionist account of the evolution of the “doctrine of prior appropriation” in western water law:

For some law and economics scholars, the evolution of the prior appropriation doctrine is explained due to the high value of water in the dry climate and the necessity of a private property regime to ensure maximum utilisation of this valuable natural resource. As a result, the history of prior appropriation is often used as evidence of the superiority of private property over a common property regime for scarce resources.

David challenges this traditional view by digging deep into archival material from the mid to late 19th century in Colorado. Using this material, he shows that the ideology prevalent in 19th century western America was stanchly set against speculation and corporate ownership. The development of prior appropriation, where water rights are restricted by actual use and made transferable was, David argues, motivated by principles of distributive justice rather than economic efficiency and wealth maximisation. Due to this finding, David argues that property regimes are often more nuanced and complicated than a strict distinction between private property and commons. He shows that the prior appropriation theory in Colorado grew from a system of public property and provided private rights to water which were transferrable in order to try and ensure as wide a distribution of rights among actual users as possible.

Robbie’s comparative discussion of Scotland and Colorado, drawing on the distinctions between common and private property embedded in water law in both places, is fascinating and worth a click.

Flood risk is about where you build stuff

The stretch of the Rio Grande in Albuquerque where we worry most about flood risk is called the “Montaño Gap”, a couple of miles on the west side of the river in the center of town where a school, some homes, and businesses are located in lowlands with essentially no levee protection.

There was an interesting discussion Monday at the meeting of the Middle Rio Grande Conservancy District, one of the government agencies with shared responsibility for the problem (we’ve also got a city, a county, and a flood control district with confusingly overlapping jurisdictions) about how to address the problem. We’ve got a $7 million federal grant for new levee work from FEMA, so we’ve got a path forward for this. But it’s interesting to think about why this problem exists, and why we’re asking the federal taxpayers to bail us out of the problem.

“Flood” is a loaded word. Its common dictionary definition involves water flowing over land “not normally submerged” (that’s OED’s version), but we really don’t gear up the use of “flood” until the water’s reaching places where we’ve built stuff. Just downstream of the Montaño Gap (the name comes from a local street name) are stretches of open riparian forest and some sandbar islands that are also occasionally subject to water flowing over “land not normally submerged”, but when the water reaches those spots we have more modest, neutral language. “Overbanking” is the word if anyone notices, but usually when it happens there the only people who notice are water nerds. When the “overbanking” submerged my bike trail last spring, that’s when it became a “flood”.

This suggests that flooding is in part linked to human agency – not just higher water on the weather/climate side, but also the act of building stuff that’s in the way. The problem is that we tend to blame the former (weather) and think less about the latter (our responsibility for building stuff that’s in the way).

The University of California’s Nicholas Pinter published a piece this week that talks about the role of the federal government in helping sort this question. It has to do with federal flood insurance guidelines, which help provide incentives (both good and bad) for where we build stuff:

The biggest problem with flood maps in the U.S. is that they are drawn as “lines in the sand”—implying that there is a flood risk on one side and none on the other. That is a false and dangerous message. The best way to approach a line on a flood map is like seeing a poisonous snake: Don’t panic, but stay well clear.

This issue was handled deftly by the Obama administration. In January 2015, Obama issued Executive Order 13690, which established the new Federal Flood Risk Management Standard (FFRMS). In brief, this standard called for a more cautious approach to construction at the boundaries of flood hazard zones. The approach was flexible and didn’t even require an admission of climate change as being the cause—just more caution.

In Houston, we built a lot of stuff that’s now in the way of water from Harvey running off the land on the way to the sea. That’s a big part of what’s making this event a “flood”.

We’ve had quite a few opportunities recently to rethink this question. Sadly, as  Pinter points out, two weeks ago the Trump administration rescinded the Obama-era executive order aimed at bringing a bit of sanity to the incentives (good and bad) associated with federal flood insurance.

Some notes on New Mexico’s improving water situation

Three interesting visuals for a Friday morning to help illustrate New Mexico’s improving water situation, with caveats.

One

For this first time since the federal Drought Monitor began operations in January 2000, New Mexico is completely free of drought or unusually dry conditions. Our map is clear:

New Mexico, free of drought

This is excellent news, as Olivier Uyttebrouck noted on the front page of this morning’s Albuquerque Journal:

A healthy drought map is particularly good for ranchers who rely on rainfall to green up their range lands, said John Fleck, director of the University of New Mexico Water Resources Program. New Mexico also continues to benefit from the best river flows since 2005, which benefits irrigators, he said.

But don’t look for amber waves of grain growing on New Mexico’s fruited plains anytime soon.

The drought monitor map provides a good snapshot of short-term drought conditions, but New Mexico remains locked in a 15-year dry period, as evidenced by historically low water levels at Elephant Butte Reservoir, Fleck said.

Which brings us to….

Two

Elephant Butte Reservoir, the largest on the Rio Grande, is up 150,000 acre feet from last year at this time, but it is still only 15 percent full.

Elephant Butte Reservoir, courtesy USBR

Well that’s depressing!

In fact, the period of steep decline in Elephant Butte’s levels since the turn of the century is marked by a prolonged period of below-average flows on the Rio Grande. At Otowi, the key measurement point for Rio Grande Compact compliance, this year was just the third year since 2000 with above average flows.

But there’s an important point hidden in the data. Since 2000, New Mexico has continued to meet its obligations to deliver the required amount of water to Elephant Butte under the Rio Grande Compact. In fact, according to data from the New Mexico Interstate Stream Commission and the Rio Grande Compact Commission, we’ve over-delivered by some 240,000 acre feet.

In other words, after all water uses in New Mexico’s Middle Rio Grande Valley, we have still had sufficient water to deliver a surplus to downstream users despite 14 of the last 17 years having below average flows on the Rio Grande.

(As an aside for the wonks in the audience, one of the reasons for Elephant Butte’s decline despite receiving surplus deliveries is the use of a compact accounting method known as a “relinquishment,” which essentially allows some of that surplus to be sent downstream for farmers during dry times, rather than remaining in Elephant  Butte. There have been 380,000 acre feet of relinquishments since 2000. Absent the relinquishments, we’d be running a compact surplus.)

Which brings us to….

Three

The aquifer beneath my Albuquerque home has risen 35-plus feet in less than a decade:

This is a big deal.

It has resulted from a dramatic reduction in groundwater pumping. There are two drivers:

  • significant conservation success (per capita use has been cut nearly in half since 1995)
  • a shift to the use of surface water as our primary supply

But, notably, we’ve been able to make that groundwater->surface water shift while still continuing to meet our delivery obligations under the Rio Grande Compact to downstream users.

As I told Olivier, “In the long term, we have to remember that this is still a dry state. The kinds of things we’ve been doing to manage in times of scarcity, we can’t let up.”

But we’re doing OK right now, water-wise.

irrigating less

In 1940, Los Angeles County had 250,000 acres of harvested cropland. By the end of World War II LA County was, by far, the most agriculturally productive county in California. In the most recent Census of Agriculture, conducted in 2012, acreage had declined to just 40,000 acres and LA County was but a minor contributor to California’s agricultural economy.

Water is only one of the reasons. LA got an oil economy early, it developed a rich and complex urban economy, and as a result agriculture was displaced by other types of economic activity. But water is an important part of the story. Much of the region’s early agricultural economy was based on unsustainable levels of groundwater pumping. As William Blomquist documents in the sadly rare Dividing the Waters (for the short and far less expensive version, I talk about this in my book), a big part of what happened is an early realization of that unsustainability, and moves to adjudicate and manage the region’s groundwater basins.

Kern County ag

In the evolution of California agriculture in the decades since, production greatly expanded in the state’s vast Central Valley. Kern County, at the heart of Central Valley ag, grew from 363,000 harvested acres in 1940 to 735,000 harvested acres in the 2012 Census. Accompanying the shift – unsustainable groundwater pumping.

It is inevitable, as Lois Henry reports in what is sadly her last water column for the Bakersfield Californian, that Kern’s irrigated acreage is going to decline. The proximate regulatory reason is California’s Sustainable Groundwater Management Act (“SGMA”, and yes we pronounce it “sigma”). But the deeper reality is that there just isn’t the water down there to keep pumping groundwater the way we are now:

In the best-case scenario, Kern could lose 185,000 irrigated acres.

SGMA or not, irrigated acreage in Kern and other places like it is going to decline. The question is how we manage our trip down the glide path, which is why I am so sad Blomquist’s book is rare and out of print. It provides some great examples of managing that process well.

a note on methods:

One of my UNM Water Resources Program students has been asking me about my research methods. I have had a hard time providing useful answers because my methods are chaotic. That is unhelpful. So let me document them here for this particular case.

  1. I was reading my Twitter water list with my morning coffee, and saw a link to Lois Henry’s column.
  2. The column
  3. Seeing acreage for Kern County discussed in the column, I turned to the Census of Agriculture, which has piles of agricultural data at the level of U.S. counties.
  4. In the upper left box on the 2012 Census of Agriculture is a pull-down menu for older census publications. This takes you to the USDA Census of Agriculture’s historical archive, which is a treasure trove of old ag data. For me, a dangerous, deeply addictive, wondrous trove of old ag data.
    1. Ag data is water data. Water data is ag data.
  5. I already knew the LA County water<->ag story (sorry Tom, not sure yet how to help you with this “already knew” bit), so I pulled up the 1940-1945 data for comparison purposes.
  6. For the picture, I used the USDA’s Cropscape tool

On the Colorado, the lowest water use in 25 years

Yes, a good snowpack helped us this year in the Colorado River. But the numbers are clear – reductions in water use made a far larger contribution to the good news on the river this year.

Projected year-end Colorado River storage

This week’s official Bureau of Reclamation declaration that we won’t have a 2018 Colorado River shortage got a lot of press, much of it attributing the success as Brandon Loomis did to a good snowpack in the Rockies:

A snowy winter in the Rocky Mountains helped Colorado River water users escape a shortage for the next year and likely for at least two more, federal water managers project.

But attributing it just to weather misses what I think is the most important part. Here’s Henry Brean:

Above-average flows in the Colorado River helped keep Lake Mead out of shortage for another year, but the real news is on the demand side.

Over the past year, Nevada, Arizona and California combined to use less than 7 million acre-feet of river water for the first time in 25 years.

Colby Pellegrino, Colorado River programs manager for the Southern Nevada Water Authority, said the decline in demand is proof that conservation efforts on the Colorado are making an impact.

The last time the three lower basin states combined to use less than 7 million acre-feet of river water was in 1992, when the region was home to roughly 7 million fewer people than it is now.

“We’ve successfully decoupled our economic prosperity from our water use,” Pellegrino said.

The numbers support this interpretation. Total runoff this year looks like it’ll end up at about 1.4 million acre feet above average. But total combined storage in Lake Mead and Lake Powell will end up about 2.7 million acre feet above average.

Total Lower Basin Colorado River water use – Arizona, Nevada, and California – is forecast to be 6.6 million acre feet this year, the lowest it’s been since 1992.

In the Upper Basin, in a year with supply 1.4 million acre feet above average, Lake Powell is rising by 2.1 million acre feet. In other words, even if this hadn’t been an above average year, we’d be ahead of the game.

This is a tricky time, because we can’t be complacent about this and use it as an excuse to relax and assume all is well and we can start taking more water from the river. See Udall and Overpeck on hot droughts and climate change for a reminder of the challenges ahead. But it’s a clear message that the things we’ve been doing over the last decade or more – read my book! – are moving us in the right direction.

What is it, exactly, about the Howitzers on Albuquerque’s Old Town Plaza that we should remember?

As is often my way, I wandered through Albuquerque’s Old Town Plaza at the tail end of my Sunday morning bike ride, stopping in the shade to enjoy the slow pace and people watching of the tourists mixed with Sunday church letting out.

That time they tried to bring the institution of legalized enslavement of human beings to New Mexico

On the west side of the plaza are a couple of replica Civil War-era canons, brass rubbed shiny by kids climbing and playing. There’s a plaque with a history that here in New Mexico we like to tell cute, about the westernmost battle of the Civil War, at Glorieta Pass, to the north of Albuquerque. Union soldiers routed a Confederate expeditionary force, and the fleeing Confederate soldiers buried their cannons in a field near what we now call Old Town so the Yankees wouldn’t get them.

The plaque’s mostly about how the Confederate officer who buried the cannons came back decades later, and they dug them up and made a display, and then later made replicas, which are what the kids have now rubbed shiny.

There’s nothing about why the cannons were here.

“A multi-ethnic democracy,” Yoni Applebaum wrote today in the Atlantic, “requires grappling honestly with the past.”

I sat for a while this morning and looked at the cannons and then, as I often do on my Sunday bike rides, wrote what you are now reading, in my head, tossing around the words and themes, as I rode back across town and up the hill to my house.

The plaque tells the story cute, about pieces of physical military hardware buried in a field, dug up, polished and mounted in a town plaza. There is no mention of the blood shed at Glorieta Pass. And, as often in the telling of this story, there is no mention of why those Confederate soldiers were here. But if we’re gonna grapple, it has to be with the reality that those soldiers were here to claim what is now New Mexico for the permanent legal enslavement of one group of human beings by another.

The Confederate troops who buried those cannons were from Texas. Here is the explanation Texans gave for joining the Confederate struggle:

She (Texas) was received as a commonwealth holding, maintaining and protecting the institution known as negro slavery – the servitude of the African to the white race within her limits – a relation that had existed from the first settlement of her wilderness by the white race, and which her people intended should exist in all future time.

I set the idea to write this aside until I got a text this afternoon from my child about a gathering this evening at 6 p.m. in solidarity with the people of Charlottesville.

It’s being held on the Old Town Plaza.

Collaboration to deal with thorny dairy water and waste problems

From Sandra Postel and National Geographic’s Freshwater Initiative, the story of a collaboration among a dairy farmer, an irrigation tech company, and an environmental group to improve water efficiency in growing dairy forage crops and reduce the impact of dairy waste:

A 2015 pilot of the system on a 40-acre (16.2-hectare) field of silage corn at De Jager Farms produced stellar results. Water use efficiency increased by 38 percent, nitrogen use efficiency by 52 percent, and corn yield by 15 percent.

While saving water was Ray’s initial motivation, the reduced leaching of nutrients into groundwater could have broad societal benefits if more dairies adopt this innovative system.

That time we built a dam in Glen Canyon

Lauren Steely, late of the Bren School, did a neat analysis a few days ago to help visualize Oroville Dam inflow data. She’s using R’s joyplot tool, which is all the rage these days as a new day to line up and visualize variability in datasets that have repeating patterns.

Like, for example, the annual hydrograph on a river.

Here is the way I had been looking at data from the USGS gauge at Lees Ferry, downstream from Glen Canyon Dam on the Colorado River:

Lees Ferry Gauge, Colorado River, data courtesy USGS

It tells a story. You can see the change when they completed Glen Canyon Dam in the early 1960s, and the huge flows in 1983 and for several years after. (See The Emerald Mile.) But it’s kinda squinty and dorky.

I’m not much of a programmer, but happily Lauren shared her code, which I adapted to my data problem. Here’s the same data in a joyplot:

joyplot of USGS Lees Ferry Gauge

The blank lines in the early 1960s are when they were first filling Lake Powell. The little nubs in the bottom right are the Glen Canyon Dam/Grand Canyon experimental environmental pulses.

The mountain ranges in the upper center are what a river looks like before you build the dams.