
A typical John Fleck morning these days involves a cup of coffee (or two) and a curlup in the comfy chair as dawn creeps over my backyard while I wander the western United States looking at USGS stream gauges.
Today’s gauge-of-the-day is my friend and colleague Eric Kuhn’s, at Glenwood Springs, Colorado. It’s just downstream from the junction with the Roaring Fork. Flows of ~3,600 cubic feet per second on June 13 were the fourth lowest since gauging at that spot began in 1967.
Important to understand what this is telling us. This is the measure for the main stem of the Colorado as it flows out of the mountains over the divide from Denver. It is not what in overall basin management we think of as the “Colorado River” as a whole, which the water managers in the state of Colorado charmingly call the “big river”. At this point the “Colorado” is just one of three big tributaries – the Green, the Colorado, and the San Juan. To understand the overall health of the “big river” system, you need to look at all three. More on that tomorrow.
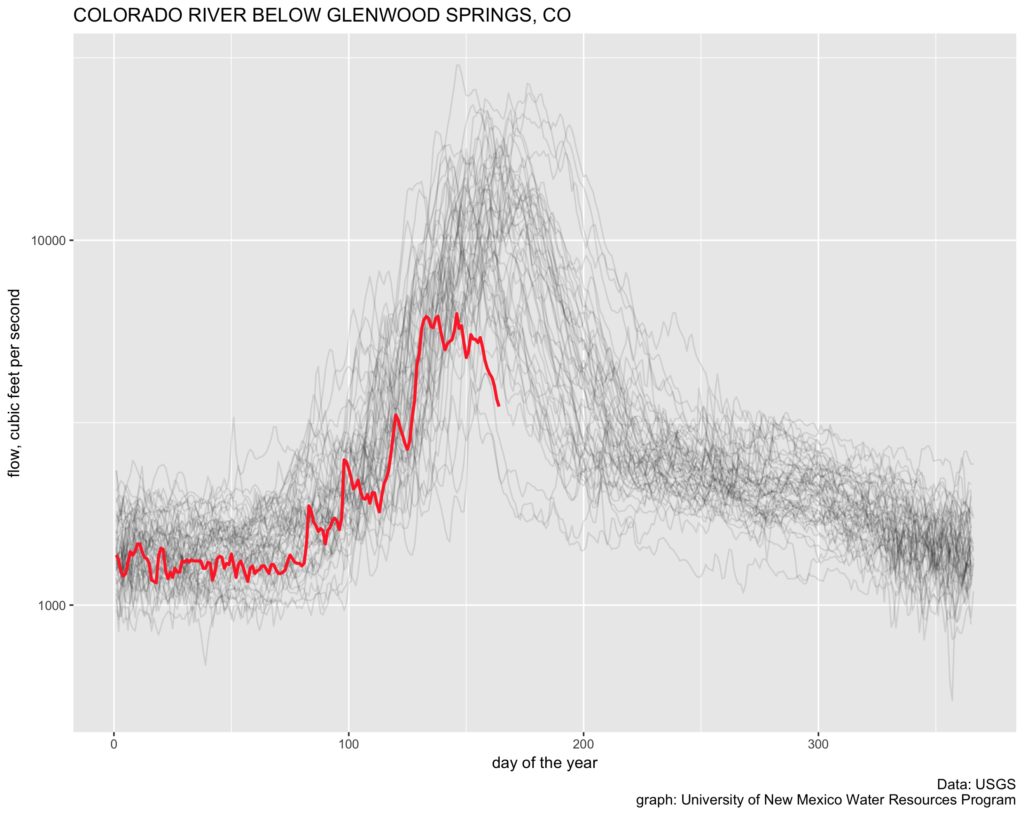
Colorado River at Glenwood Springs
The driest years, in order:
- 2012: 2,230 cfs
- 2002: 2,280 cfs
- 1977: 2,870 cfs
Median flow for this point in the year is ~9,600.*
* There’s a slight discrepancy between the numbers reported on the USGS web site when you click on the link above, versus the numbers I’m getting downloading the USGS data and doing my own analysis directly. Dunno. YMMV.
** Code here.
Your comments about ‘differences’ in the data:
When looking at real time data from a gage, this is known as provisional data. It is considered ‘raw’. It can contain data on sensors that are out of calibration. In some cases the readings are several hundreds of an inch off. The errors are discovered and corrected for (in the final record).
Other things that influence ‘real time’ data collection versus local ‘log dump’ data (from the site) include data resolution. There are two types of resolution — physical sensor resolution and time-series resolution of the collection.
I can think of other factors here that will influence different collection numbers. Just think of real time data as unprocessed and not the final product.
About data collection in general — the deeper you dig into the data, the more problems you will discover.
This graph also shows “peak” flow occurring several weeks earlier than average (or what ever the appropriate statistical term would be.)
Pingback: Roaming Charges: Singapore Fling