
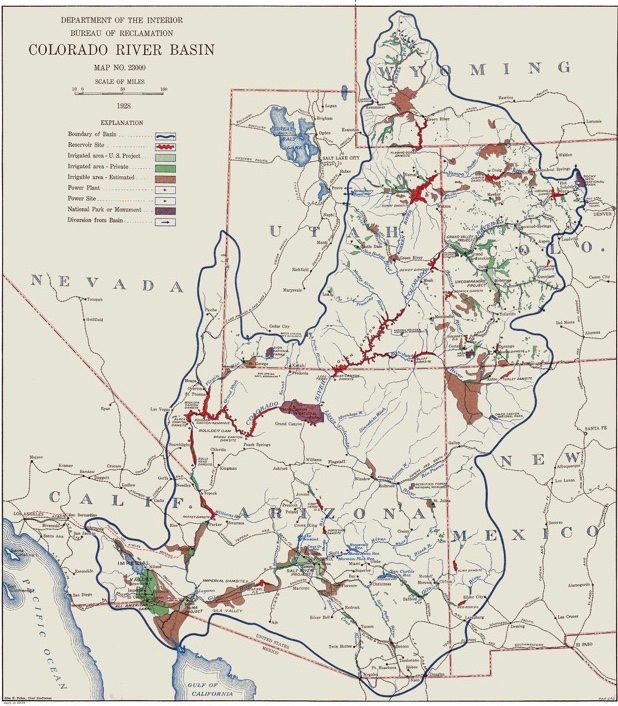
1928 USBR map
A guest post by Doug Kenney, University of Colorado
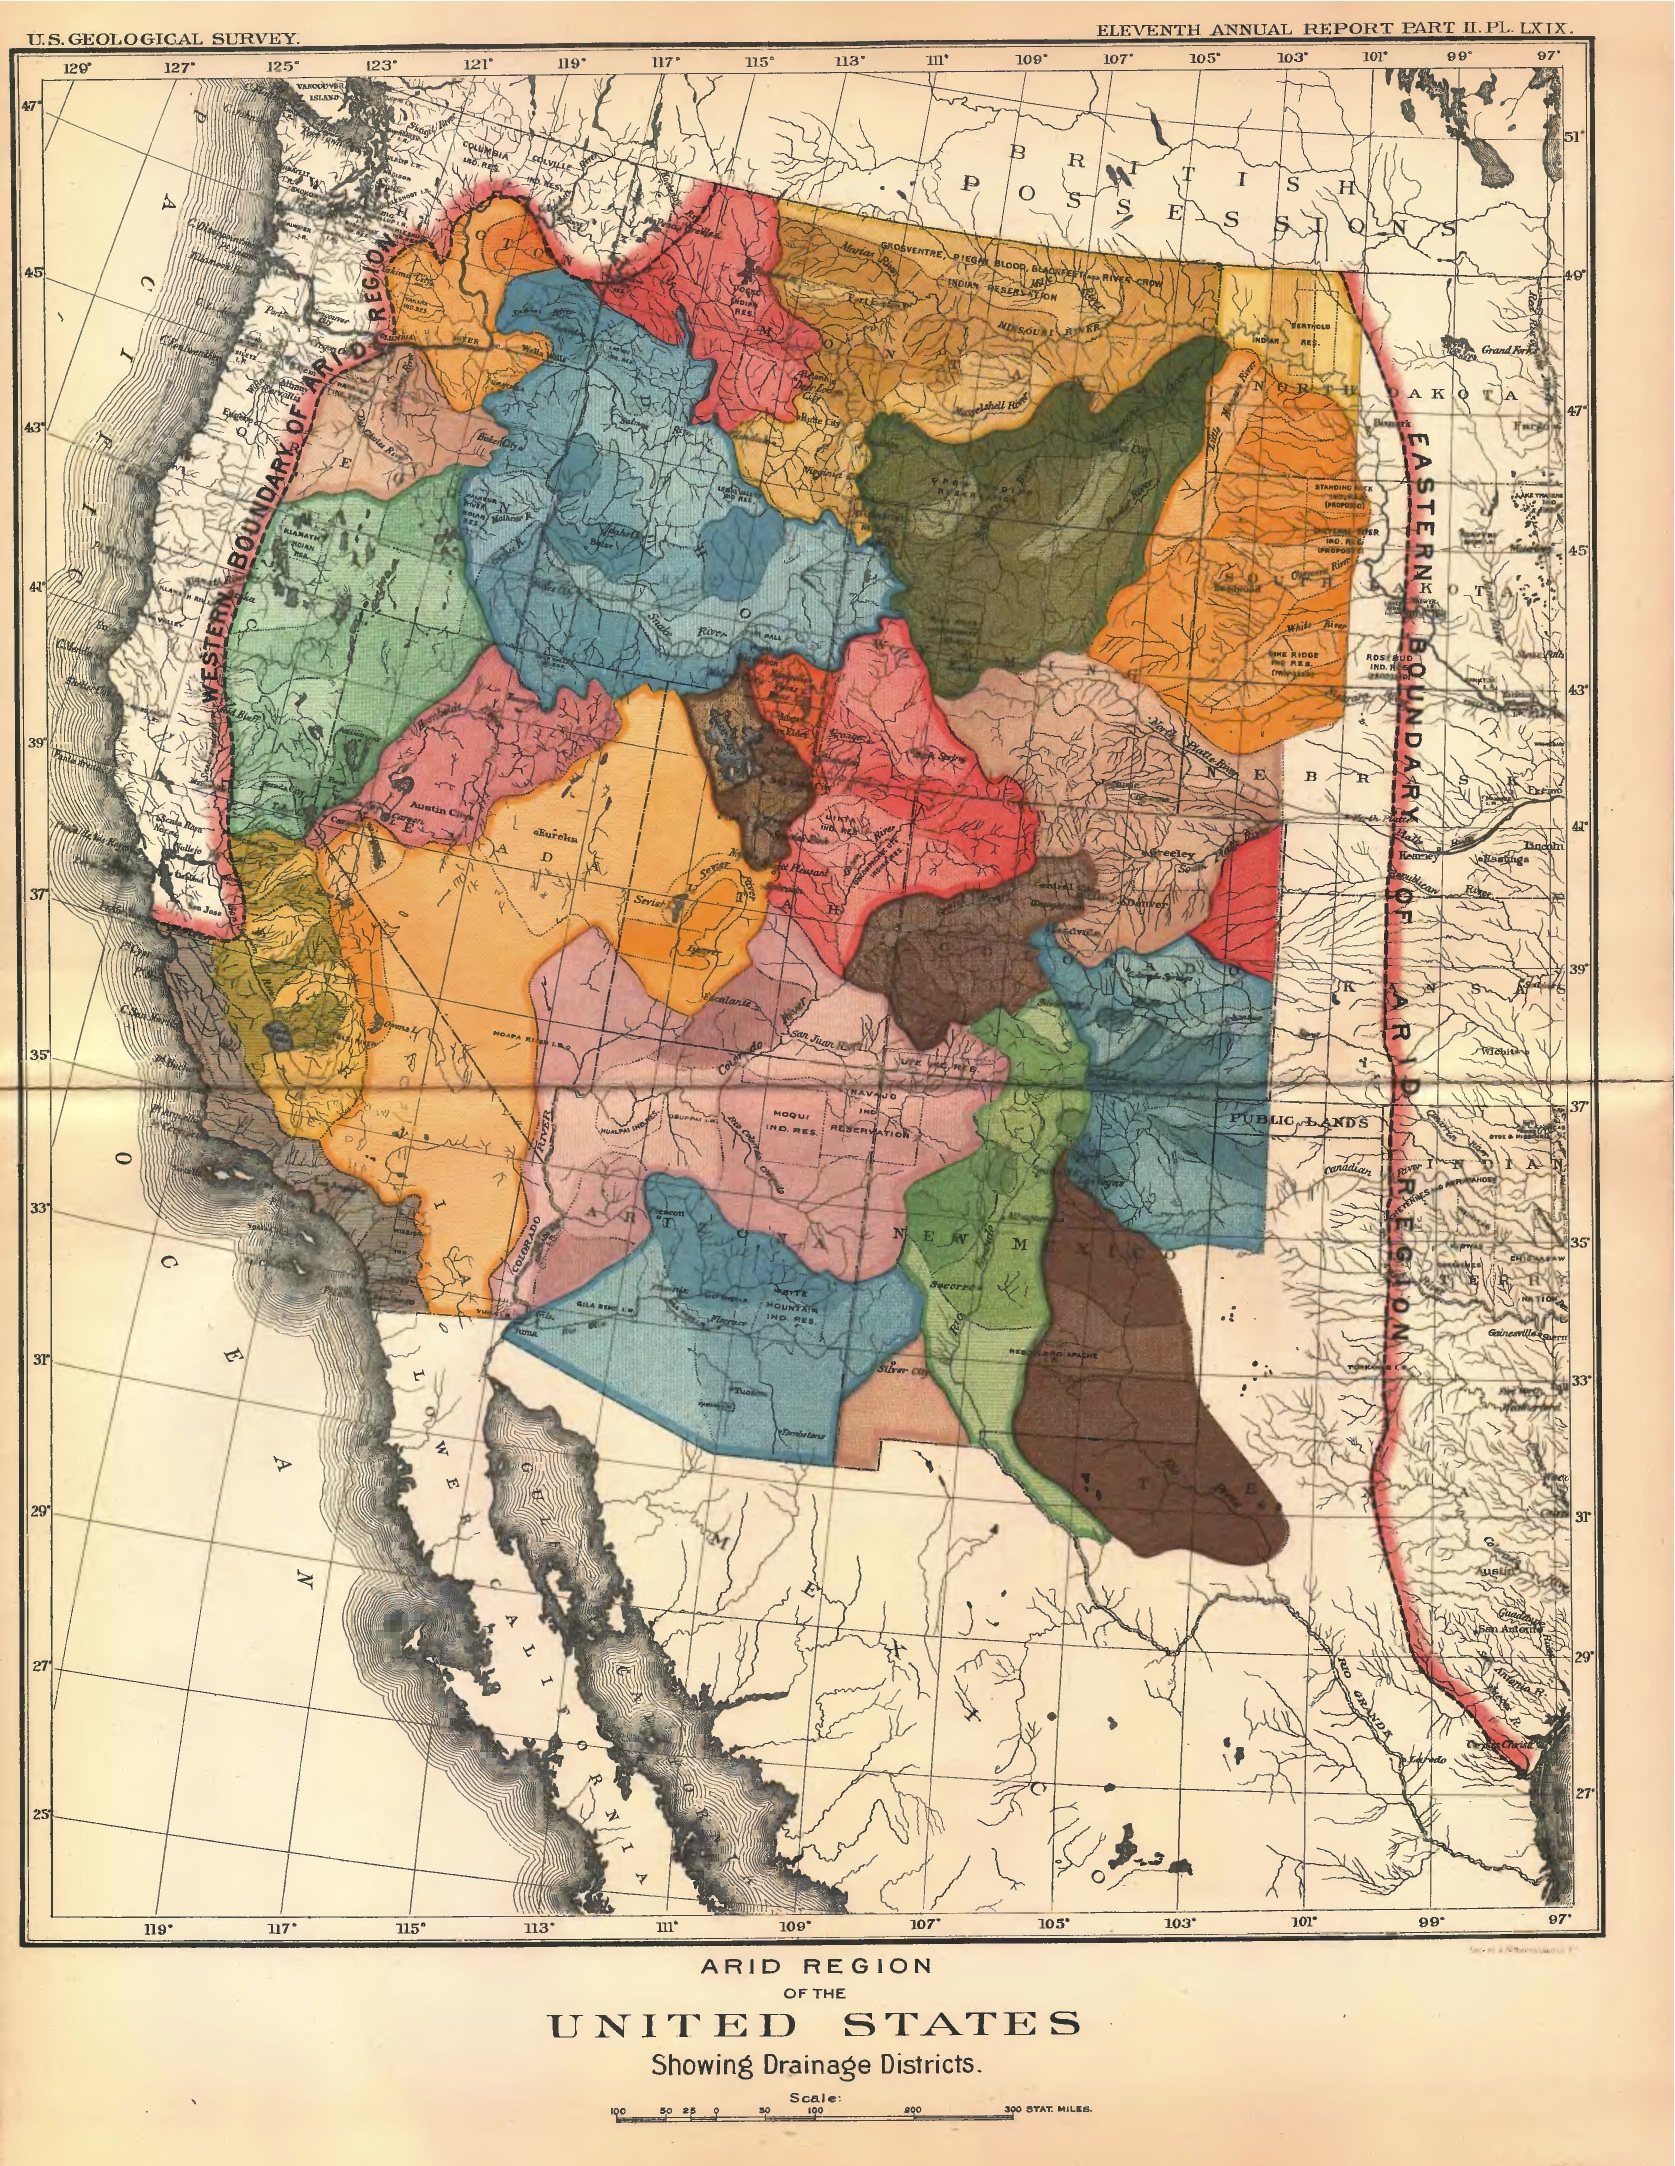
John Wesley Powell, circa 1890
In recent months, we’ve probably all encountered a dozen or more articles reflecting on the 150-year anniversary of the Colorado River voyage of John Wesley Powell. It’s a story coming from the tail end of an era when map-makers used to be among the most adventurous of all scientists, a task today that can be mostly automated and driven by data coming from a variety of remote sensing technologies. In comparison to today, Powell’s techniques—albeit exciting—seem primitive and imprecise. Yet, I’m not sure we have really made much progress.
I say this because I’ve spent half a day tormented by a problem that has already tormented me many times before in my career: where can one find a Colorado River Basin map that is accurate? It seems like such a simple task, but as others have noted before (namely Sara Porterfield on this blog on April 7, 2018) it is an ongoing problem. The list of problem areas is long, and many seem to have a strong political motivation:
Mexico
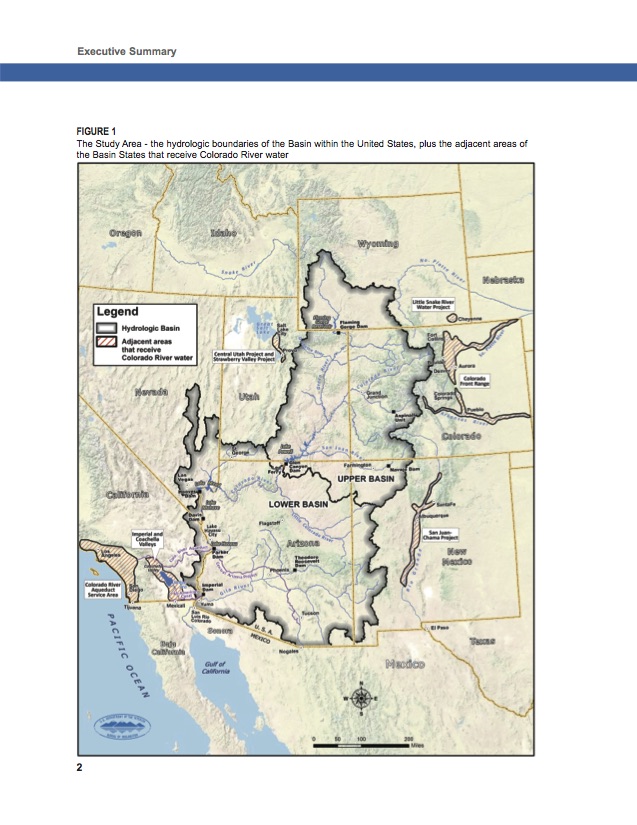
2012 Basin Map
The most common problem is the treatment of Mexico. Many maps, including most “official” Department of Interior publications, exclude Mexico entirely, envisioning that the water molecules of the basin dutifully stop their downhill march anytime they approach the US/Mexico border. At the other extreme are maps that greatly exaggerate the Mexican land area in the hydrologic basin. As Sara discusses in her post, the decision to include (or not include) Mexico, and how much of Mexico, often is driven by political considerations. But it also, I’m told, reflects confusion surrounding the USGS shape files regarding lands in northern Mexico. Where the land is really flat, defining the exact hydrologic boundaries is indeed complicated, but is this really a problem in the GPS era? I believe the “real” basin map should show a bump of Mexican territory near Nogales and one near the main channel, but frankly, I’m unsure if that’s the true, hydrologic reality.
Salton Sea
A similar problem surrounds the Salton Sea. Clearly there is a hydrologic connection; the Salton Sea was formed by, and is sustained by, water from the Colorado River mainstem, sometimes through natural processes, sometimes via engineering failures, and sometimes by deliberate management actions. How best to characterize this connection via a map is unclear to me, but it is also clear that this is an important issue that we ignore at substantial peril. This was highlighted in the final days of DCP negotiations by the unwillingness of IID to sign onto the historic agreement
Flows to the Sea
Another issue with almost all Colorado River maps is that they show the river reaching the ocean. Of course, this has not been the reality for half a century. Those of us “on the inside” in Colorado River matters understand this, but why do our maps keep this secret from the rest of the population? Are modern map-makers lazy or careless, or do they want to avoid the hard conversations about why more and more of the world’s rivers die an early death miles short of the sea? About the only map I’ve seen (thanks to a tip from Sara) that tries to show this is on Wikipedia, which the author made using USGS data.
Wyoming’s Great Divide Basin
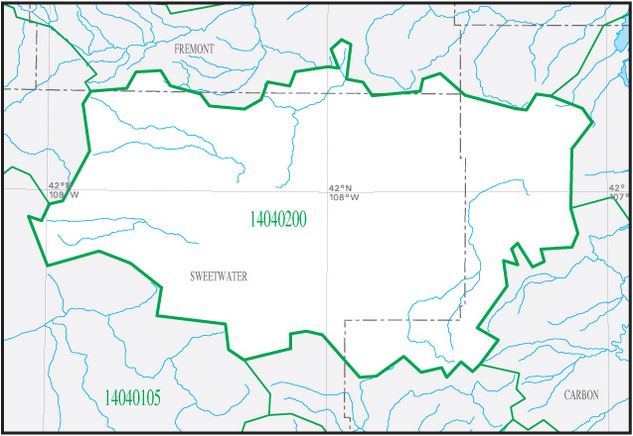 Another common area of dispute is the so-called Great Divide in Wyoming, a closed basin which Brad Udall tells me is at HUC 140402. On the Wikipedia map, it’s the bump you see midway between Casper and Rock Springs. The pattern, it seems, is to omit this area on the older Colorado River Basin maps, and include it on the newer maps. What happened? Did the topography of Wyoming change (damn, it’s the Yellowstone supervolcano, isn’t it)? Did a Wyoming representative decide it was politically useful to instruct the federal map-makers to have the Colorado River Basin appropriate the Great Divide Basin (and if so, why)? If the map-makers feel it’s appropriate to include the Great Divide Basin, does this modify the case for including the Salton Sea?
And So On….
I’m sure a longer list could be generated, as I’ve heard rumblings of other issues as well. Personally, the one that most intrigues me is the groundwater issue; namely, in regions where surface and groundwater are used conjunctively and/or share a direct hydrologic connection, does a map of either resource individually really show us something useful, or conversely, does it hamstring our ability to make smart management decisions? Some research suggests that over half the flow of the Colorado River comes from groundwater. We all like to talk about each year’s snowpack levels, but maybe what’s happening below our feet is worth noting as well? Similarly, is there a compelling reason for maps to include state lines and the US/Mexico border, but not reservation lands, or is that too slippery a slope leading someone to question the omission of water districts and other jurisdictions of importance? Where, literally, should we draw the lines? Do map-makers agonize over these choices?
I know many of my colleagues share these frustrations—I’ve heard them. And as is the case for me, they do not see this as obscure issues for cartographers to debate; these are issues with real policy implications. It shapes our thinking about who and what to include in policy and management decisions. It is something we should do better. Or, maybe we should just load up our modern rafts with sandwiches and Coors Light, and charge downriver reflecting on those days when map-making was the realm of the most courageous and forward-looking scientists. That sounds easier. In the meantime, please excuse the maps you see in virtually every Colorado River document since Powell—as best as I can tell, they are all wrong, and on many issues, are getting worse every generation.
Given the Great Divide Basin is endorheic, it should NOT be included. (Besides, it’s not a single basin: https://en.wikipedia.org/wiki/Great_Divide_Basin) On the Salton Sea, I would have something like a dashed line including the current Salton Basin.
I mean, nobody considers the Plains of San Augustin part of the Rio Grande basin, right?
as water flows depend upon gravity and the hydrolic cycle i would say that the most accurate map will be one which shows only the flows due to gravity – currently impeded by some dams and polciies which are damaging to the broader world.
if you want a map of the various augmented and adjusted flows that is something completely different and would be much wider (and would include the Salton Sea and various other movements of water to other regions).
The Salton Sea is just one example where “Mother Nature” once governed whether it was part of the Colorado River system (Ancient Lake Cahuilla and smaller overflows due to changes in geology & hydrology of the Delta area); and then at the turn of the last century, “Man” first created the Sea [& fed it through (Colorado River) irrigation runoff] and later dammed the River so there would be no more deviations into the rift valley that is the Coachella/Imperial/Mexicali valleys. Now the Sea is shrinking, both from evaporation and decisions made by Man. Pick a date & your map will change, like most things in life.