
Based on the latest federal forecasts (pdf from USBR here), we can expect Lake Powell to drop 20 feet this year and Lake Mead to drop 10 feet. That’s the midpoint forecast. Could be better if it snows. Could be worse. So far the trend based on the first half of January leans toward worse.
NOAA’s Colorado Basin River Forecast Center has built cool new graphical tools you can use to follow the pain in real time. Click on any of the little colored triangles to get the current forecast for unregulated flows at that river measurement point. The human forecasters expect 61 percent of average inflow into Lake Powell this year. The model “thinks” it’ll be more like 42 percent. Both have big error bars, depending on whether it snows between now and the start of meltoff.
Click on the “more info” link at the top of the little popup window and you get a graph like this:
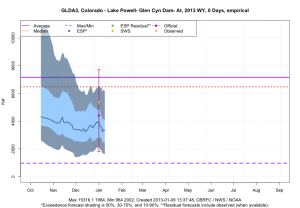
Lake Powell Inflow Forecast, courtesy CBRFC
Here’s how to read the graph.
- the dotted red line is median inflow
- the solid purple line is mean inflow
- the Y axis is the time the forecast was issued
- the blue line moving left to write is the model forecast (which I think is run once a week)
- the vertical red line is the official monthly forecast, with a human in the loop (so the one you see on there now is the January forecast)
- the light blue area spans the 30 percent and 70 percent exceedence levels
- the dark blue area spans the 10 percent and 90 percent exceedence levels
A couple of things to note. The human-in-the-loop forecast is more optimistic than the model. The model has shown continued decline since the human forecast was issued. That’s ’cause it hasn’t been snowing much.