
I just stumbled on a very cool tool from the folks at ESRI using U.S. government Landsat imagery (yay public goods! background here) allowing you to look at vegetation change over time. Here’s a graphic look at water use in Albuquerque 1990-2010. The bits in green are places where vegetation has increased. The bits in that reddish colour (magenta?) show where vegetation has decreased. It’s outdoor water conservation, visualized:
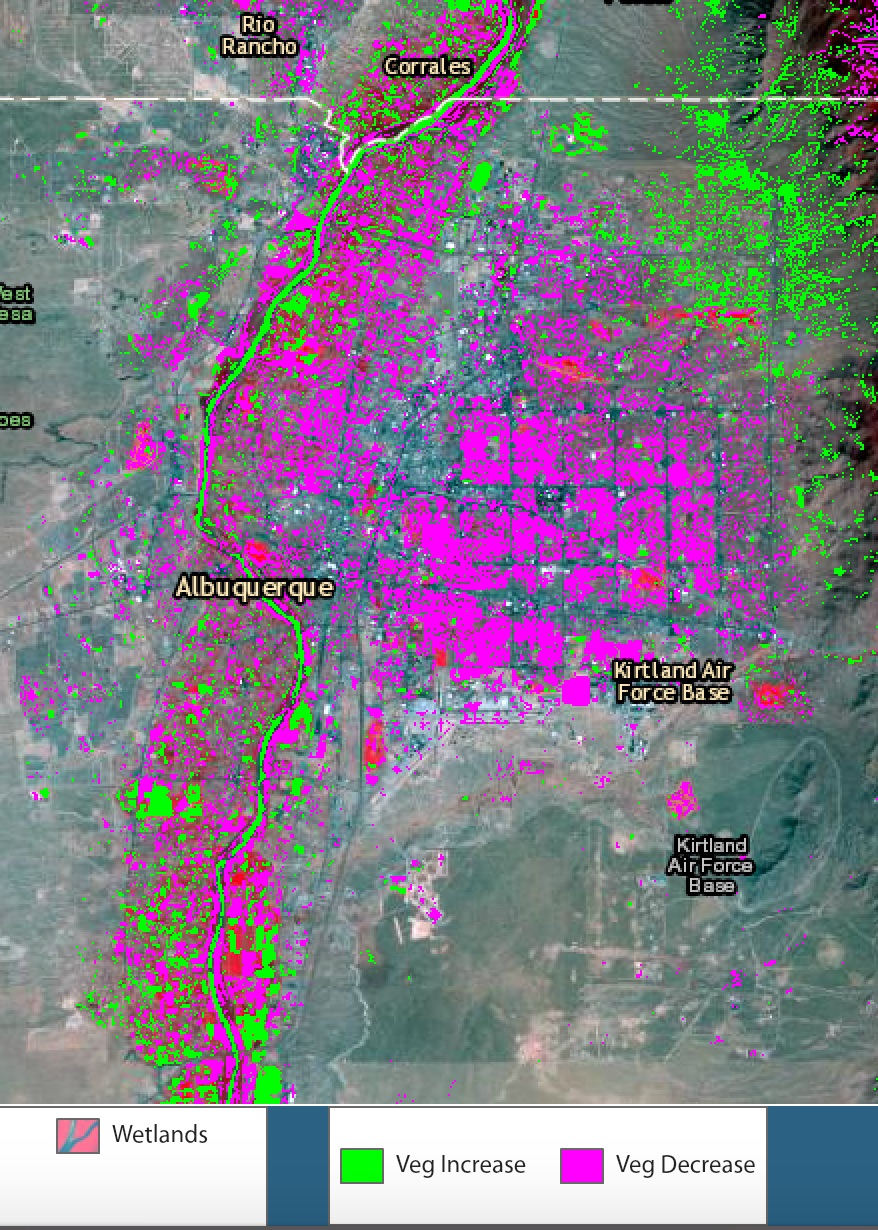
Albuquerque vegetation change, Landsat via ESRI
This covers a time period during which per capita water use has decline from ~250 gallons per person per day to something around 150. The green patch in the upper right is an area of affluent sub-urban sprawl since 1990. The reddish blotch in the center is the already developed area of town (the “northeast heights” for ABQ folks). Fewer trees and lawns.
Striking. I credit(ed) the major portion of the decrease to code-required low-flow toilets, not voluntary outdoor watering reductions.
C –
One of the checks I’ve used to sort this out is to get the sewage discharge records. Checking them against total pumping gives a good picture of how much of the conservation is indoor versus outdoor. They show that about two thirds of the conservation has been outdoor, and about one third has been indoor (much of which is, as you point out, the result of changing appliance standards).
In Las Vegas, the sewage/pumping comparison shows that about 80 percent of the conservation there was outdoor, and about 20 percent indoor. The Vegas map has the same reddish purple (magenta?) hue, with a green new development fringe.
Hi John,
Very interesting map! Thanks for sharing. It brings up a question I’ve had since reading “A Great Aridness” by William deBuys. He points out in chapter 5 (when he’s discussing Las Vegas, NV) that “not even conservation provides much of a silver bullet.” He goes on to explain “demand hardening,” and then writes something that really gave me pause: “In virtually every community that has pursued it, water conservation has principally resulted in freeing up resources that are subsequently consumed by growth.”
Here’s my question: how can one quantify where the “savings” from conservation end up?
Meg –
This question – where savings from conservation end up – is the great one. But it’s one on which Bill and I disagree. There are many examples of communities in which conservation has outpaced growth, resulting in less total water use. Albuquerque, Phoenix, and Las Vegas are three prominent examples I use in my book. The thing that I think is critical is that we recognize that these remarkable conservation savings are occurring and act purposefully about what we do with the saved water.