
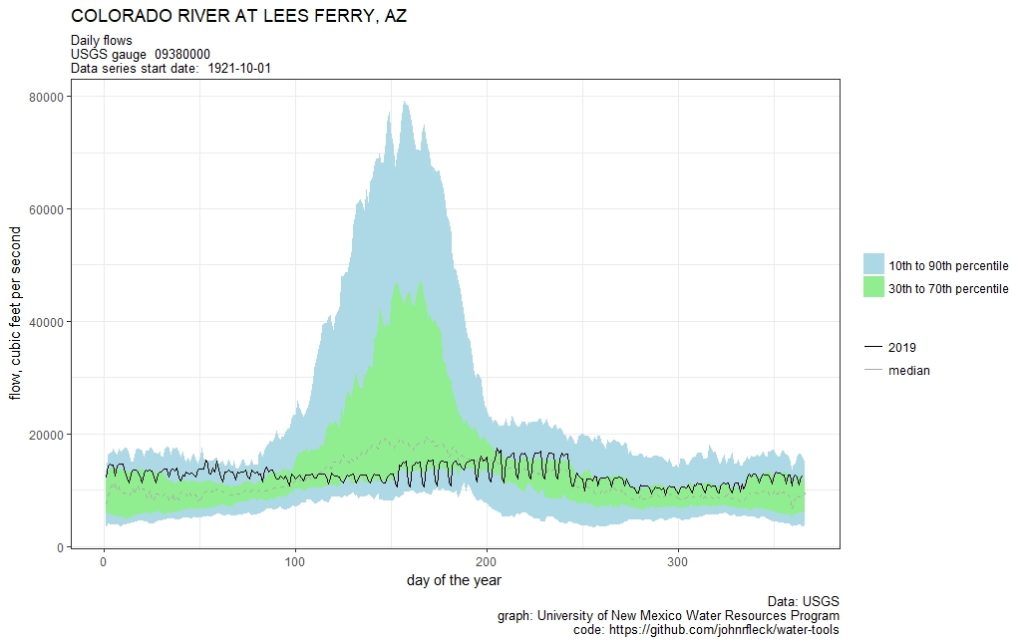
2019 flow on the Colorado River at Lee’s Ferry
One of the things I do with the students in my University of New Mexico Water Resources classes is try to develop the habit of paying attention, through repetition, to the available data on the systems we’re talking about.
We use USGS river gauges to do this – checking the gauges is a classroom routine.
This spring, we’ll be focused on the Colorado River. Class starts next week, and in getting into the rhythm myself I made the above graph of flow at Lees Ferry, the gauge just below Glen Canyon Dam, at the head of the Grand Canyon. It’s arguably the most important river gauge in the West (Eric Kuhn and I wrote a book about that and some other stuff, we have a whole section explaining why “Lees” has no apostrophe) but as I plotted the 2019 Lees Ferry flow I couldn’t help but feel like this is a very boring graph. Flows are, umm, stable.
Getting my students to start paying attention to this particular gauge may not achieve my pedagogical goals.
We call them Gages.
Another practical exercise might be looking at Releases from the Different Dams below Hoover and noting relationships of releases and the time intervals seen on the individual river gages between them. If you look close enough, you can see relationships between releases and how how reservoirs are managed. The great part is the generation of power is also a variable that they have to consider in the grand plan.
Fascinating stuff to look at.
Tier 0 clear explanation.
0 equals Arizona is still first to lose water:-
https://www.phoenixnewtimes.com/news/water-drought-arizona-southwest-farmers-groundwater-cap-mead-2020-11423832
Ha! There was some back-and-forth between Eric and I over “gage” versus “gauge” in the writing of our book. “Plain English” won out over “crazy bureaucratic tradition”.
Pat – Yes, though interestingly at “Tier -1” (is that what we should call 2019?) it was California that, voluntarily, made the biggest reduction in water use.
I’d like to receive your posts. Will this comment suffice for sign up? If not, instructions, please. Thanks