
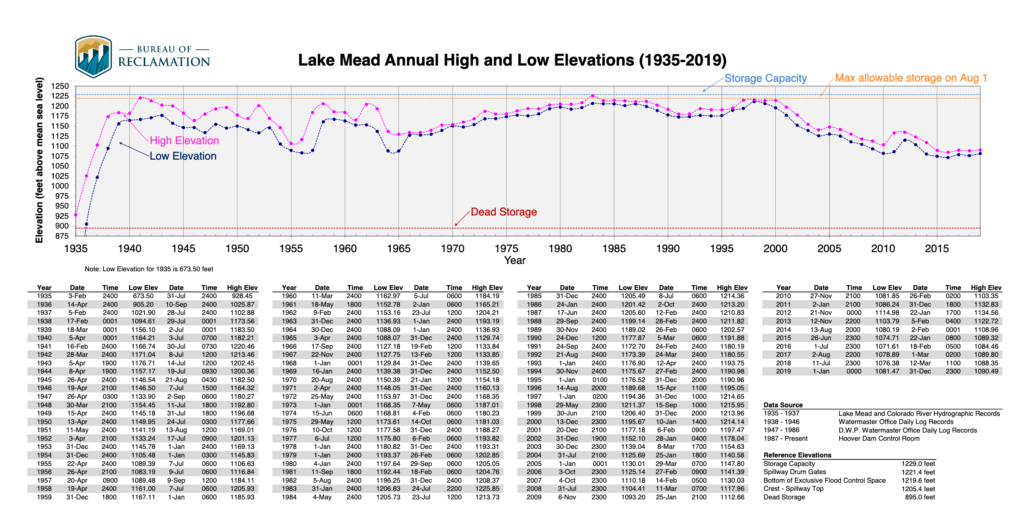
Lake Mead elevation. USBR graph
A member of the Colorado River brain trust argues that when you use reservoir elevation to define an action level of some sort, the reservoir remarkably ends up hovering around that level. The updated annual USBR Lake Mead elevation chart, just published with the 2019 data, nicely illustrates their point.
The 2007 Interim Guidelines set elevation 1,075 as the action level for the first tier of Lower Basin water use reductions. When the reservoir drops to that level (insert complicated rules about how and when the determination is made), cutbacks. You can see that in the years that followed, Mead dropped toward 1,075. In fact it actually dropped past it in 2015 and 2016 but bounced back sufficiently that we never actually triggered the cutbacks.
This year, the Basin community adopted new rules under the “Drought Contingency Plan” that created a horribly named “Tier Zero”, with cutbacks now triggered at elevation 1,090 (insert an even more complicated layer of rules about how and when the determination is made).
Mead’s lowest 2019 elevation was 1,081.47 on Jan. 1. Its highest elevation was at midnight Dec. 31, at 1,090.49.
Hovering around the line.
Can you do a post on the new “TierZero” plan? This is the first I’ve heard of it, or did I miss it on a previous posting?
On another subject, I haven’t forgotten about the photo I promised you from Hoover Dam, tours have been slow, (normal for this time of year). It’s coming I promise.
the current graph looks great! 🙂
“Tier Zero” is both an elegant and a logical name.