
Brad Udall on twitter yesterday ran through a striking series of graphs of the current state of the Colorado River. With his permission, I’m posting them here along with a slightly polished version of his accompanying commentary. Some key points that grabbed my attention:
- Second-lowest Powell inflow in a period of record we use dating to 1964.
- Risk of Powell dropping next year to levels that could jeopardize power production
- Risk of Mead dropping low enough in the next 18 months to trigger much deeper “Tier 2” reductions to Lower Basin water users in 2023.
By Brad Udall
Reclamation’s ‘unregulated inflows’ into Lake Powell show that 2021 will be the 2nd worst year after only 2002 going back to 1964. 2021 will be the RED bar most likely. This is a really grim year for runoff.
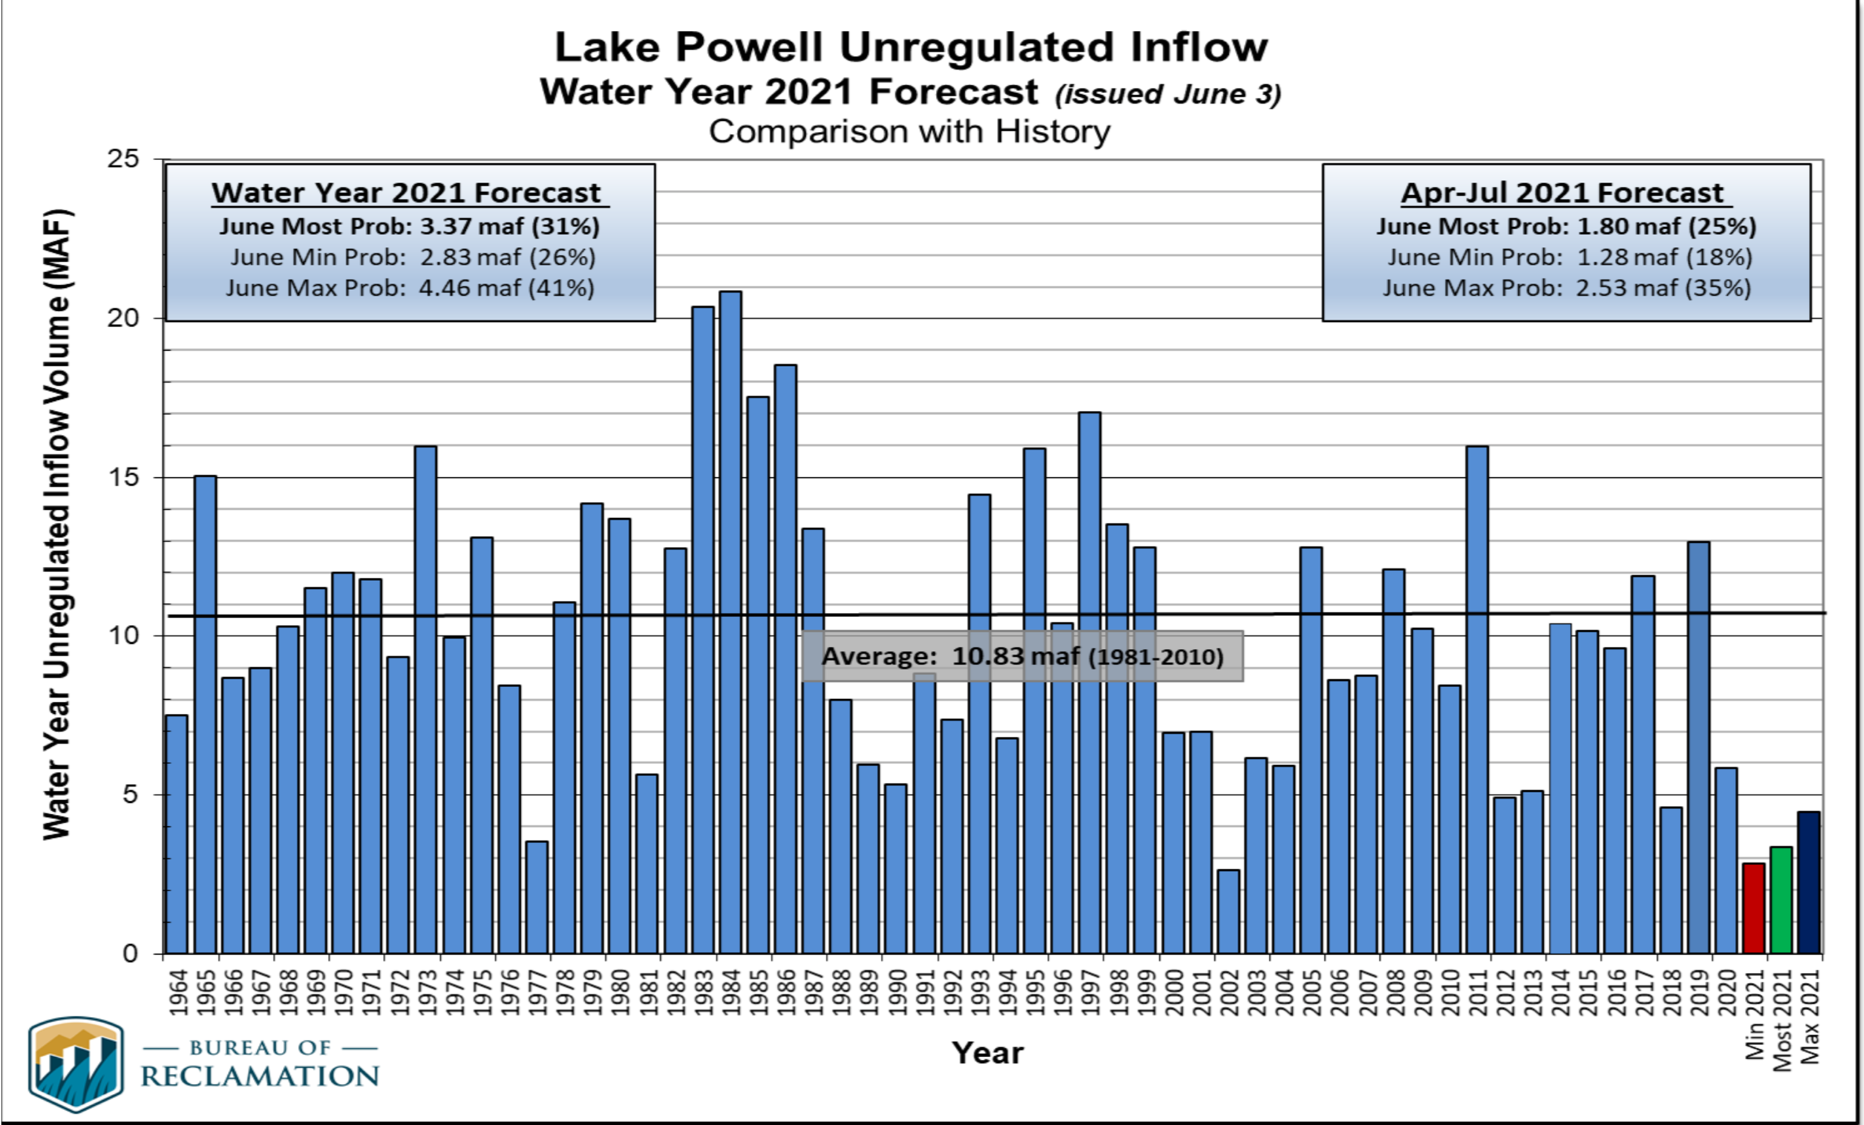
Lake Powell inflows
2021 inflow will be only ~3 maf, compared to the 1981-2010 average of 10.3 maf or the 2000-2021 average of 8.3 maf (20% less than 1981-2010 average).(maf = million acrefeet)
Considering that Powell will release or lose to evaporation ~ 8.5 maf, the lake will lose ~ 5 maf this year or ~55 feet of elevation.
April 2021 snowpack above Powell peaked at ~85% of normal but will generate about 25% of normal river flow. This comes on top of April 2020 snowpack of 100% of normal that generated about 50% of normal flow.
Declining runoff efficiency has been noted in multiple peer-reviewed studies. For a recent overview of recent climate change studies on the Colorado River see this written with Jonathan Overpeck:
Multiple studies since 2016 have now found human fingerprints on the nearly 20% loss in flow since 2000 and attribute up to half of that loss to the approximately 1.2°C or more warming that has occurred during the last century.
Jeff Lukas points out that the twitter thread implied that the low runoff efficiency this year as measured by runoff as a percent of snowpack is all due directly to warming. I did not mean to imply that. The low runoff percent numbers are much more a function of (1) very low spring precipitation in both 2020 and 2021 and to a lesser extent (2) low soil moisture from the previous year. It may be that there is a human-caused connection to the low spring precipitation although there’s no real evidence of this yet. Low soil moisture in the springs of 2020 and 2021 is definitely connected to dry and very warm late summer and early fall from the previous years. Teasing this apart to obtain the actual driver(s) is not simple. That said, no one should doubt that climate change is reducing the flows of the Colorado. Multiple peer-reviewed papers have now supported this finding.
More from Jeff on this here.
Here’s what’s going to happen to the nation’s 2 largest reservoirs because of this measly inflow:

Losses to Mead and Powell
Note that combined contents will drop below 30% by late next year.
Here’s that decline for all years back to 1935 when Mead first filled. These two reservoirs will hold less water than Mead did alone in many years before 1964 when Powell was built.
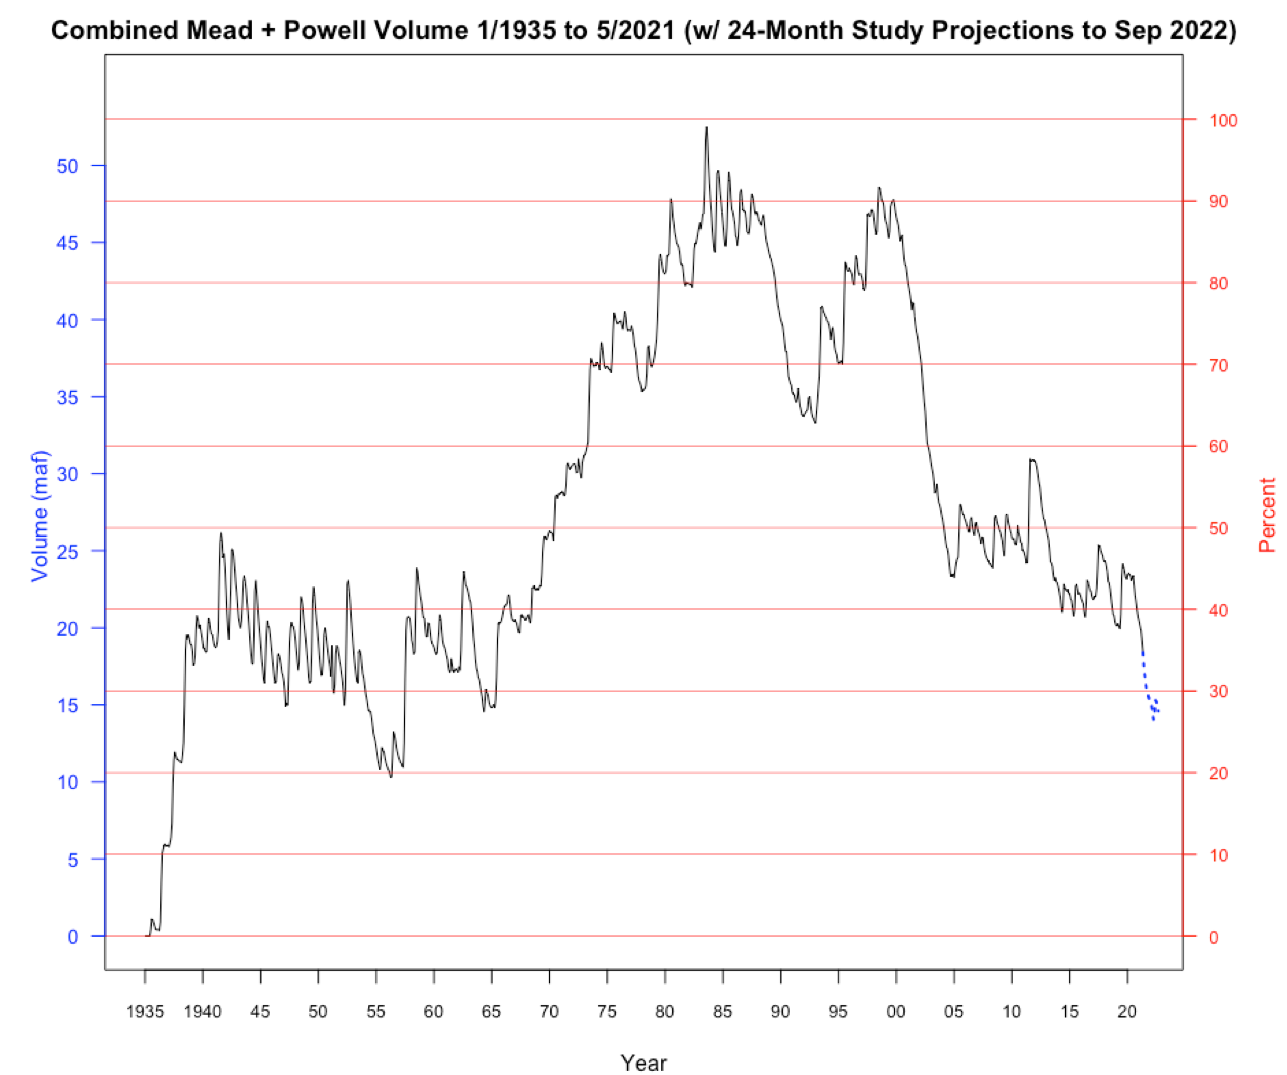
Combined storage, Mead and Powell
By next April Powell will hit 5.4 maf, ~185 feet below full. See Red dots. This will be the lowest since its initial fill in 1964. Since 1999, Powell will have lost ~18 maf, 75% of its contents.
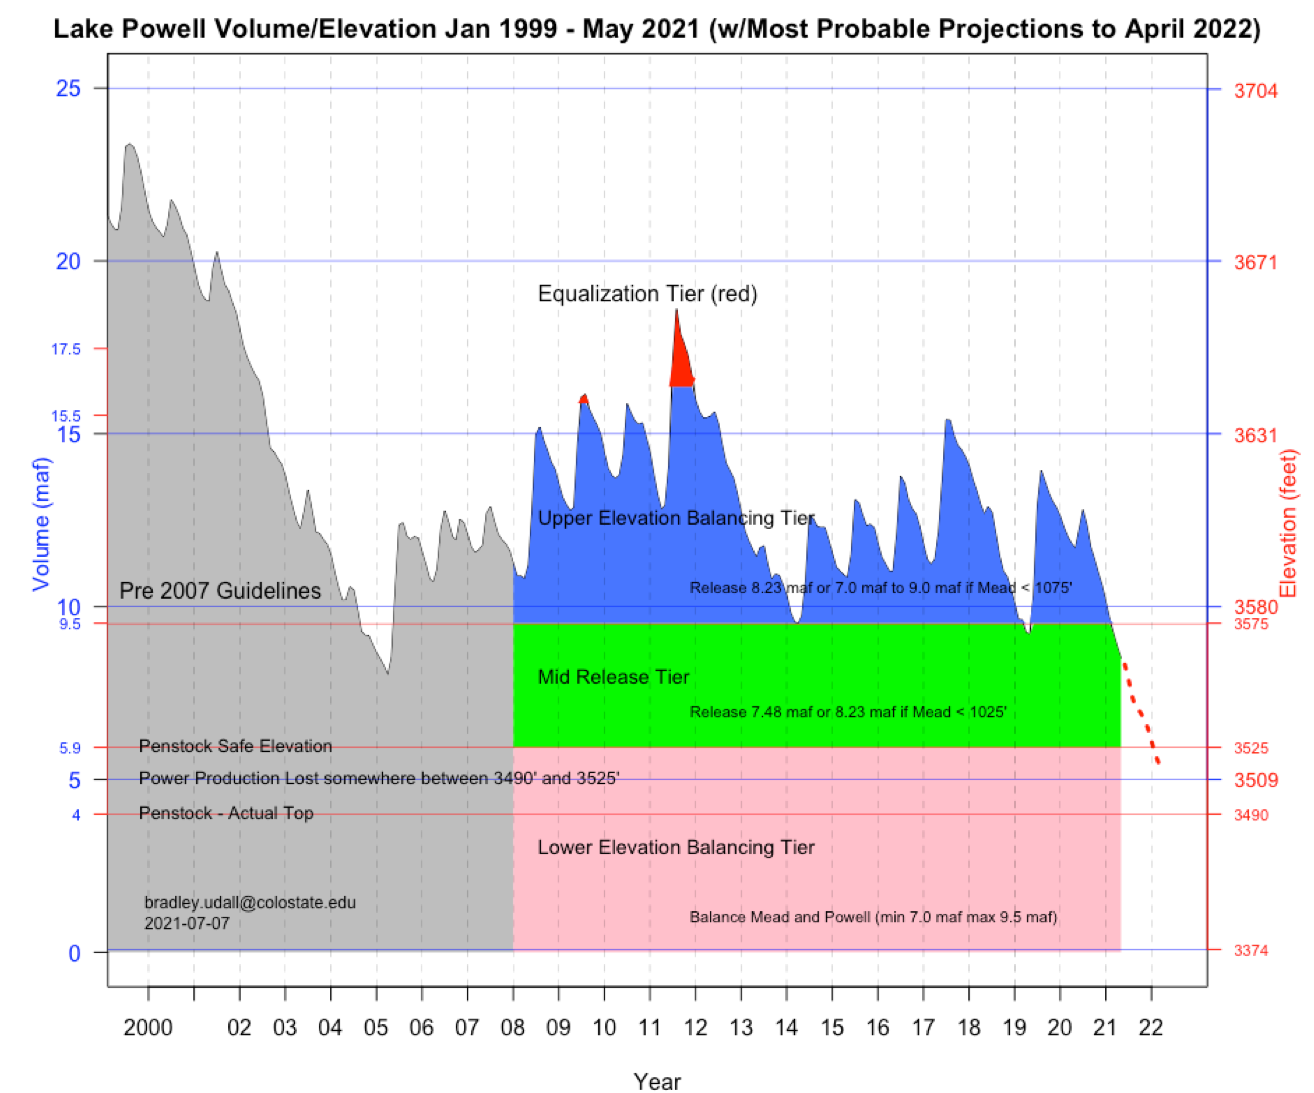
At 5.4 maf Powell could be low enough to lose the ability to generate power. (We’re uncertain about how penstocks operate when lake gets low — water in penstocks can not be aerated or turbine damage will occur.)
Loss of power, while not calamitous, is concerning. Power revenues fund environmental compliance and other important items in the basin.
As part of the 2019 agreement, the UB can release flows from reservoirs upstream of Powell to prop it up. But there is only about 5 maf for that all together. It is a one-shot deal.
We’ll have to wait on next winter to understand what happens after April of 2022. But 5.4 maf is very little water in a 25 maf reservoir.
So what about Lake Mead, the nation’s largest reservoir?
Reclamation’s current forecasts show January 1, 2022 elevation at 1065’ feet (8.8 maf) , well below the 1075’ needed to avoid a ‘Tier 1 Shortage’.
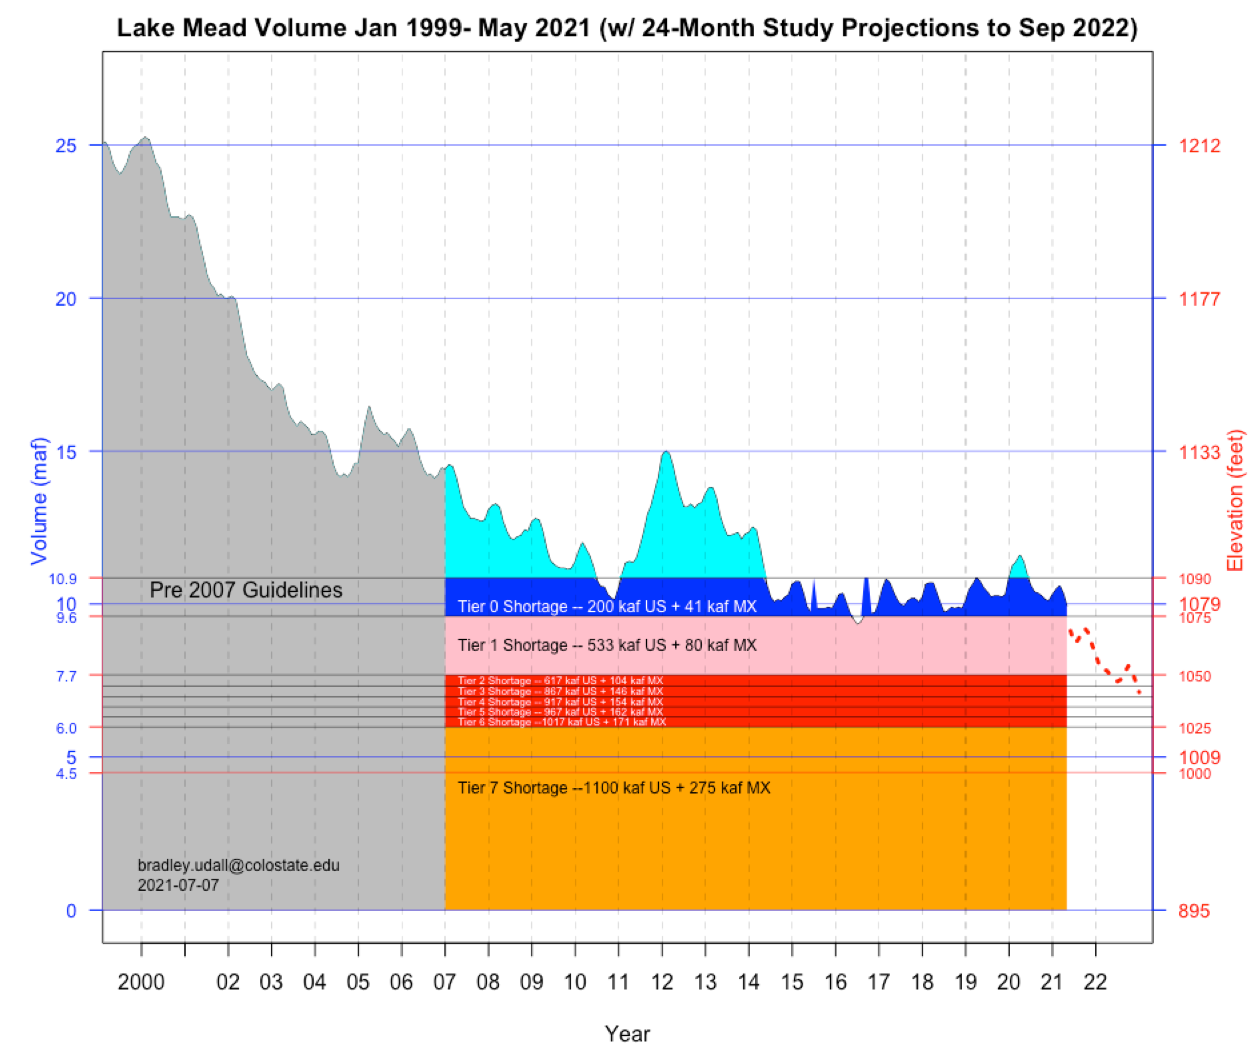
Decline of Lake Mead
If it ends up below 1050’ on Jan 1 (as projected in August 2022), that will lead to a Tier 2 Shortage (total cutbacks of 721 kaf). Otherwise, Mead will face a 2nd year of Tier 1 shortages. Either way, this is not good.
Does this grim assessment take recent rains into consideration?
Thanks for the excellent recap of some of the recent modeling work on the hydrology of the Colorado River Basin. Question: To what extent does the work being done by the USU and the BOR and others consider likely increases in the populations which will need to be primarily supported by the Colorado River stream flows? From a back-of-the-envelope calculation I did recently, it appears that if the population of the seven Colorado River Basin states grows at the same rate during this decade as during the LAST decade – i.e. 10% – the River is going to be expected to support another 4-6 million by the end of this decade. Do you know how this is being considered in the various modeling exercises?