
By Brad Udall, posted with permission, from his Aug. 18, 2021 presentation to the Colorado Water Conservation Board
Colorado State University’s Brad Udall has been doing some really interesting thinking about how to conceptualize and communicate climate change risk to water supplies in the Colorado River Basin.
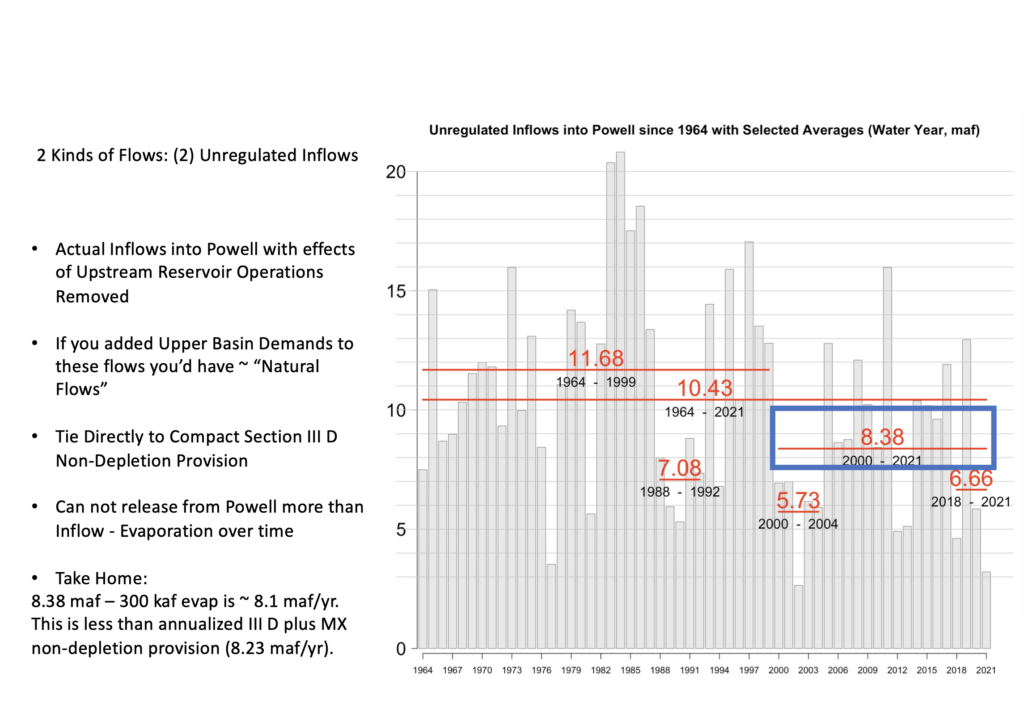
Shown above (and shared with permission) is one of Brad’s “selected averages” graphs. The horizontal lines show the average river flow value for a period of interest – the entire period of record, for example, or the 21st century. (It’s from a presentation Brad gave to the Colorado Water Conservation Board earlier this month.)
While the general pattern will likely be familiar to people working on Colorado River issues – wetter in the long run, drier in recent decades – the value being graphed may not be. It’s “unregulated inflows”, which is the number calculated by the Bureau of Reclamation and the Colorado Basin River Forecast Center to estimate the actual inflows into Lake Powell, minus the impact of upstream reservoir operations.
It’s the best number to use if you want to look at the the actual water flowing into Lake Powell, and therefore available to meet compact-driven Upper Basin commitments to deliver water downstream to the Lower Basin at Lee Ferry. It combines both natural flows, and Upper Basin consumptive uses.
The key number to look at here is the one in the blue box. Since 2000, the average unregulated inflows have been 8.38 million acre feet per year. The Upper Basin’s Lee Ferry compact delivery “obligation” (lawyers please don’t subpoena me on this point, I ) is 8.23 maf, which means that we’re right on the edge of trouble even now, in terms of the Upper Basin’s ability to meet the expected deliveries to users in the Lower Basin. Increased Upper Basin use, or decreased flow (see Brad’s 6.66maf for 2018-2021) would cross that trouble threshold.
What this means is that, based on 21st century hydrology, the Upper Basin is already caught in what Doug Kenney and colleagues dubbed “the Upper Basin climate change squeeze”.
This is what Brad and I were getting at in our May editorial in Science. Lower flow scenarios are entirely credible based on the best available climate science and the hydrology we are seeing. We need analyses – modeling runs – that consider them as we prepare for the next round of river management negotiations, so that we know what will do if Brad’s scary “6.66” is a harbinger of our future.
What for John? Will it make any more water? I thought the Compact deliveries to Lower Basin State were only 7.5 MAF. We should have oodles of water for the LBS? Shouldn’t we be looking at ways to save evap water.
What for John? Will it make any more water? I thought the Compact deliveries to Lower Basin State were only 7.5 MAF. We should have oodles of water for the LBS? Shouldn’t we be looking at ways to save evap water. I tried to do that several time in the past 20 years and met with inexorable prevention.
Bill –
It won’t make more water. It will help us develop plans for how to use less – perhaps negotiate a deal with the Lower Basin that recognizes the reality that the Upper Basin shouldn’t face the entire burden for responding to climate change. One of the most important conclusions of the Lower Basin experience over the last ten-plus years is that, given the lead time to plan, communities are pretty good at making do with less water and coming up with mutually beneficially agreements to share.
If we don’t plan, we’re fucked.
Our obligation is 8.25 maf – the 7.5 maf from the compact’s Article III a and d, plus half the Mexican treaty obligation.
1) When you’re subpoenaed (and you will be subpoenaed), be sure your quotes are around “delivery” instead of obligation – it’s actually a “non-depletion” obligation.
2) Brad’s numbers suggest the need to analyze & act is now… not in some future negotiations.
3) Language John. Some of the 40 million people reliant on this River are children.
Here’s a question: If 6.66 were delivered every year, starting this year, how many years would it be before a compact call occurred? Note this story, which says the currently 10-year rolling average is 92maf: https://www.montrosepress.com/news/as-lake-powell-woes-worry-west-experts-call-for-yet-more-reduced-use/article_d34239ae-f95c-11eb-975a-230d69fb366f.html
It might be useful and educational to make a graph, if 10 maf were delivered every year, and then another line for 9maf were delivered every year, then another line for 8maf, then another line for 7maf, with the lines extending to the year a compact call would occur.
All best,
Gary
There is one addition that would make such analyses more helpful: error bars. The numbers provided are based on measurements and estimates (eg evaporative loss) which are subject to uncertainties and errors, it is useful to know what these uncertainties are. That also enables one to see how statistically significant the changes in the means shown in the figure are. People sometimes confuse precision and accuracy but they are two different things.
It looks like ground moisture levels took everyone by surprise this past spring. I knew they were bad, but not that bad.