
A declining Colorado River. Via Schmidt, John C., Charles B. Yackulic, and Eric Kuhn. “The Colorado River water crisis: Its origin and the future.” Wiley Interdisciplinary Reviews: Water (2023): e1672.
Jack Schmidt, Charles Yackulic, and Eric Kuhn have published an invaluable new overview of how we got into this mess on the Colorado River, and some of the things we need to think about to get out of it.
Schmidt, John C., Charles B. Yackulic, and Eric Kuhn. “The Colorado River water crisis: Its origin and the future.” Wiley Interdisciplinary Reviews: Water (2023): e1672. (I think that’s an open link, if for some reason it doesn’t work – I’m sitting on a university campus right now, so my Internet may be tunneling past a paywall – drop a note in the comments and I’ll find a way to help y’all get to it.)
They’ve pulled together the best available data on supply and water use in the basin, and touch on the major issues that must be addressed going forward.
Some highlights:
21st century trends
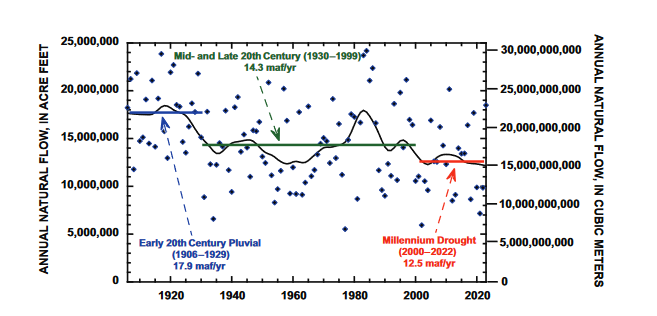
The present water crisis has arisen, because average Basin-wide consumptive uses exceeded the natural supply throughout the 21st century. Between calendar year (CY) 2000 and CY2020 (the most recent available year of Upper Basin data), consumptive uses and losses were 15.1 million af/yr (18.6 billion m3), approximately 1.5 million af/yr (1.9 billion m3) more than the average supply for the same period…. The overuse of water was sustained for more than two decades by significantly draining of reservoir storage, especially from Lake Mead and Lake Powell where more than 80% of the total Basin-wide reservoir storage capacity exists. Between January 2000 and April 2023, the combined contents of Lake Mead and Lake Powell declined by 33.5 million af (41.3 billion m3) (Figure 4), and those two reservoirs are now 30% of capacity.
On the supply-use imbalance
Although it is easy to articulate the general principal that use must match supply, it is more difficult to precisely define the magnitude of the needed reduction…. Assuming persistence of conditions like those of the past 20 years, use would have to be reduced by 1.5 million af/yr (2 billion m 3 /yr) to match supply, but an additional 1 million af/yr (1 billion m 3/yr) of reduction would be needed to recover lost reservoir storage. Thus, to stabilize the reservoirs, Basin-wide use would have to be reduced to 12-13 million af/yr (15-16 billion m 3 /yr), 13-20% less than the average during the 21st century.
On the environmental challenges
The constraints on improving ecosystem conditions in the Colorado River delta are formidable, because most of the modern channel is dry. However, a binational collaboration of nongovernment organizations (NGOs), federal and state agencies, and universities have created patches of native vegetation that attract birds and other wildlife. Water is routed to these restoration sites using the existing network of Mexican irrigation canals…. Opportunities to recover additional areas of native riparian vegetation and to reestablish base flows depend on negotiations focused on revising reservoir operating and shortage agreements, including a new Minute of the binational water treaty, and the ability of the NGOs to raise funds to support their on-the-ground restoration work.
and
the future of the Grand Canyon ecosystem is tightly linked with decisions regarding reservoir operations and water use. In the context of the Law of the River, flow through Grand Canyon represents the delivery of water from the Upper Basin to the Lower Basin. In the context of environmental conditions in Grand Canyon, the magnitude of annual volumes as well as the amount of water stored in both reservoirs are significant drivers of ecosystem conditions.
If you are trying to understand the current situation on the Colorado River, there is no better place to start. It’s going into the fall syllabus for our UNM Water Resources course.
Is the graph flow at the Lobato Gage. It is so scattered you could make up almost any story you want. What would be interesting is to look as aritthmetic vs geometric mean flow a decade at a time to determine whether the law of large numbers applies and the standard deviation a decade at a dtime. Also kurtosis and skewness would be interesting. Also you could look at these parameters for the entire set of numbers. Send me the numbers in a spreadsheet and I’ll do it for you.
Kudos to Schmidt et al. for using an accurate map of the Colorado River basin as Figure 1, showing the Salton Trough and entire subaerial delta region correctly as part of the river’s natural hydrologic system. The Bureau of Reclamation — which persists in incorrectly depicting the Salton Trough as an out-of-basin region to which the river’s water is exported — should take note, and modify their own map accordingly. The only reason the Colorado River has not flowed into the Salton Trough and central Salton Basin during the past 100+ years is that it was intentionally *prevented* from doing so. (See, e.g. https://www.researchgate.net/publication/340038533_Formation_of_California's_Salton_Sea_in_1905-07_was_not_accidental.)
The best legal protection for an instream flow such as Grand Canyon is a senior downstream calling right such as SoCal.
I enjoy your posts and worked with Al Utton at UNM law in the 1970’s.