
It is telling that I got excited when I noticed inflow into New Mexico’s Middle Rio Grande Valley approaching “normal”, which I now define as the median of 21st century flow.
Our climate-altered world, y’all.
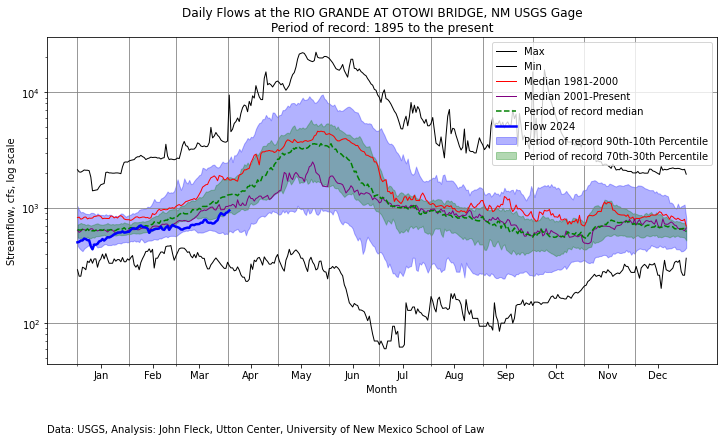
A note on the evolution of the graph: I’ve added the “max” and “min” lines back. I dropped them because I thought it made things too busy, but it was creating confusion because the top and bottom of the purple looked like the most/least.
Hi John, while I appreciate the usefulness of logarithmic scales for being able to discern patterns at the low end of the flow range, it does somewhat hide the magnitude of the changes pre/post 2000. The median peak flow since 2000 is barely half of the median peak in the 81-00 period, but you wouldn’t know that without paying close attention to the y-axis scale. And while the 2024 flows are indeed approaching the recent median, they are still roughly 10% below that line (again, something hard to discern from a log plot).
Can you post a second with linear scaling?
Cheers!
You are so right, John! There in fact has been an ongoing back and forth between my friends how use this graph and I about which works better. I generally favor the linear, because I find it more intuitive – and I think it reads better to the non-nerds who don’t spend much time looking at and thinking about log scale representations. I’ve posted a new one in a new blog post with a linear scale.