
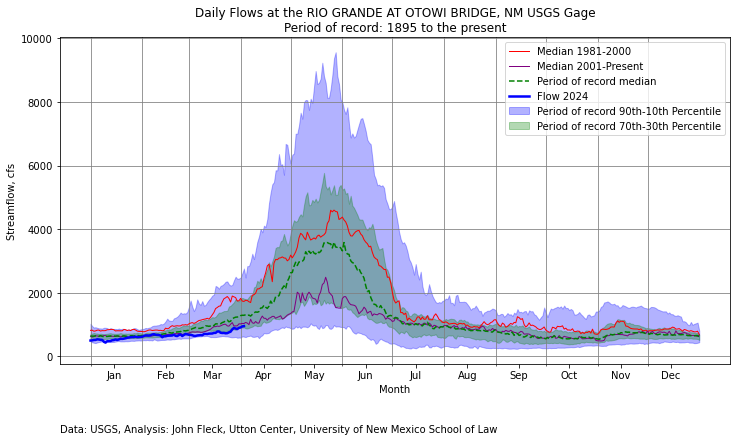
Rio Grande Otowi flow using linear rather than log scale
Alert Inkstain reader John correctly questions the impression left by the log scale I used last time ’round in my graph of flow at Otowi:
[W]hile I appreciate the usefulness of logarithmic scales for being able to discern patterns at the low end of the flow range, it does somewhat hide the magnitude of the changes pre/post 2000. The median peak flow since 2000 is barely half of the median peak in the 81-00 period, but you wouldn’t know that without paying close attention to the y-axis scale. And while the 2024 flows are indeed approaching the recent median, they are still roughly 10% below that line (again, something hard to discern from a log plot).
John highlights a fascinating tradeoff that we (the folks who use my graph and I) have been debating since I started doing it. Log scale does a much better job of highlighting the low flow parts of the graph, but John’s right that it hides important intuitions, for example masking the striking difference in peaks between the 1981-2000 period and our climate altered world.
Note that to make this read better, I went back to dropping the max and min lines.