
Every pixel tells a story.
I’ve been learning over the last few months how to make better use of the cornucopia of remote sensing data, satellites flying overhead snapping our picture, Instagram writ large. It offers a helpful reframing of my thinking about how water is spread across the landscape of New Mexico’s Middle Rio Grande Valley.
Sometimes we do it with intentionality and purpose, turning a farm field into a shopping center, running municipal lines to a new neighborhood, or abandoning an old one. (Yes, the latter has happened.) Sometimes the landscape grabs water on its own, trees dipping their roots into the shallow aquifer on the valley floor. Sometimes we do it because we value the green. Sometimes the change in green is just a side effect, water stuff just happens. Sometimes the satellite data helps answer questions. Mostly right now, for me, it suggests new questions to which I don’t know the answers.
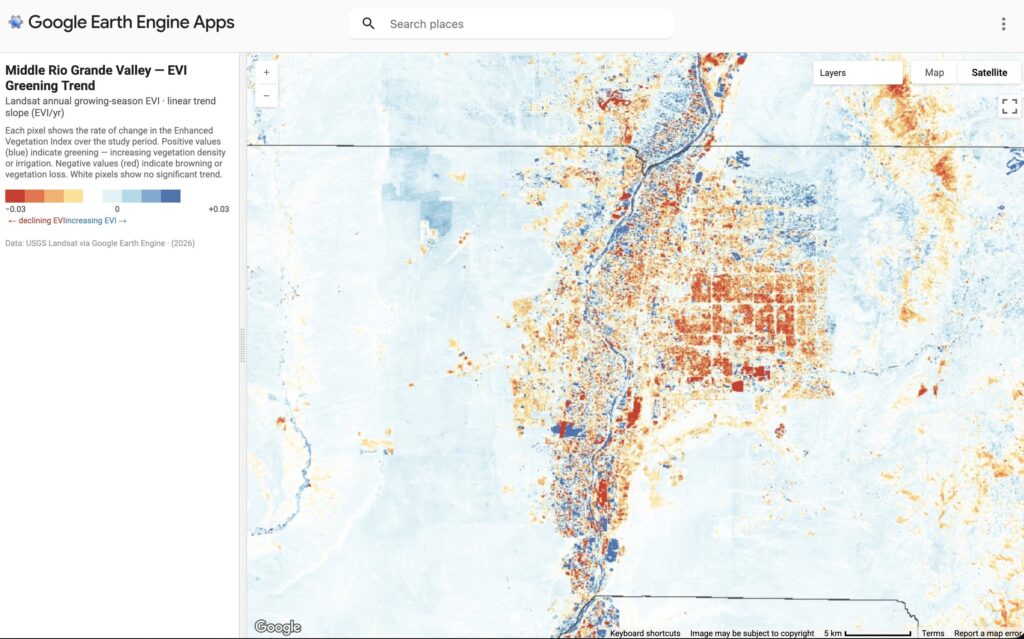
Consider the map above. I’ve been staring at it for the last week in QGIS, the mapping software on my laptop. I built a Google Earth Engine app so you can stare at it too.
NASA’s Landsat satellites have been flying around snapping our pictures since the early ’70s, and with enough resolution beginning in the mid-’80s to begin seriously looking at the questions I’m interested in. The image above draws on algorithmic magic that creates an enhanced vegetation index showing which of the little pixels are vegetate – the thing we do with our consumptive use of water, making our desert landscape green. For the map above, I’ve colored each pixel to show the vegetation trend over time – blue ones have gotten more vegetated (by implication using more water), red ones have gotten less vegetated.
The map is full of “duh” moments – neighborhoods built since the 1980s are blue, as we turn desert into homes with trees and gardens, cars out front and kids’ basketball hoops in the cul-de-sacs. The former Kirtland Air Force neighborhoods along the northern edge of the base light up red. No more cul-de-sacs and basketball hoops, no more trees. The old farms of the South Valley that are no longer irrigated show up as big irregular red patches – Valle de Oro the most prominent, but the old Tobacco Farms property that’s now a Walmart, and the east side south valley farms that are now light industrial – red as well.
The riverside woods are largely greener, a riparian bosque flourishing after the combination of levees and an upstream flood control dam enabled our beloved forest to become what it is today. Except where it isn’t – the bits of red sprinkled through the bosque raise fresh questions.
The mix of blue and red on the valley floor tells a rich story – the expansion of the leafy village life of Corrales and Los Ranchos de Albuquerque as residents optimize around its mix of ditch water and unmetered domestic wells (and city water in Los Ranchos) while parcels farmed and irrigated decline. We’ve been looking at these patterns in bulk census data for years. The satellites let us see them, pixel by pixel, on the landscape.
Albuquerque’s near Northeast Heights, where I live, is fascinating. All that red! I could tell a simple just-so-story about municipal water conservation efforts that took hold in the mid-1990s, xeric gardens like mine. But it might be something as simple as a pattern of senescence of neighborhood trees build during the post-war boom of the 1950s. Maybe both? Tearing out lawns – the lawns from which they got water – dooming our aging trees?
There’s a big red pixel across the street from my house where our neighbor’s magnificent old cottonwood is no more.
There’s some sciency work going on behind all this, as my UNM colleagues and I turn toward bulk numbers and trends, trying to step away from the flattened landscape suggested by water agency numbers to the richer picture the remote sensing data offers of where the water is actually going in this coupled human-natural system, what we do with it, what we actually have reason to value.
But I also love the little stories. Every pixel tells a story.
A note on methods
The conceptual work – choice of methods, experimental design, iteration over various options of time periods, geographies, and remote sensing tools – is mine, with help from some of our smart students who have been teaching me about this remote sensing stuff for years. I use Anthropic’s Claude Code and OpenAI’s Codex for the software engineering. They are way better at writing code than I am. Most of the resulting code runs on Google Earth Engine, which supports my academic work with a generous free account.
In posting this publicly, a) I’m reasonably confident of what I’ve got, and b) I bear responsibility for the results.