I spent an unhappy evening yesterday staring at data, trying to make sense of the inevitability of change. I slept poorly.
The Rio Grande through Albuquerque is dry, the Colorado River’s reservoirs are rapidly emptying and, unable to come to grips with this reality we have thrown up our hands and tossed the future of the West to the courts.
As a result of Federal Defendants’ issuance of the Final FEIS, ROD, and 2027-2028 Operating Guidelines, Nevada stands to experience a shortfall of 213,556 acre-feet at a 3.6 maf shortage, which constitutes approximately 71% of Nevada’s Colorado River entitlement. This shortfall will cause devastating environmental, socioeconomic, and health and human safety impacts to southern Nevada and its citizens.
Nevada is perhaps the best place to engage this conversation. I turned to Las Vegas back in 2015 when I was writing Water is For Fighting Over because it offered a perfect bait and switch: its Bellagio-fountained image of opulence and water waste contrasted with a reality of the most clear-eyed understanding of the inevitability that there will be less water.
The reality is that every community in the West can use less water than it is using now. We will all have to. But there is an absurdity to a plan that would require Las Vegas to cut 71 percent. That’s existential. Of course Nevada sued.
I’m reminded of what my friend John Entsminger said last December at the Colorado River Water Users Association meeting.
If you distill down what my six partners just said, I believe there’s three common things: Here’s all the great things my state has done. Here’s how hard/impossible it is to do any more. And here are all the reasons why other people should have to do more.
As long as we keep polishing those arguments and repeating them to each other, we are going nowhere.
The irony here is that Las Vegas is a community that has clearly demonstrated what the response to climate change in the West must look like – that has aggressively developed the tools of adaptation and water use reductions.
the Albuquerque story
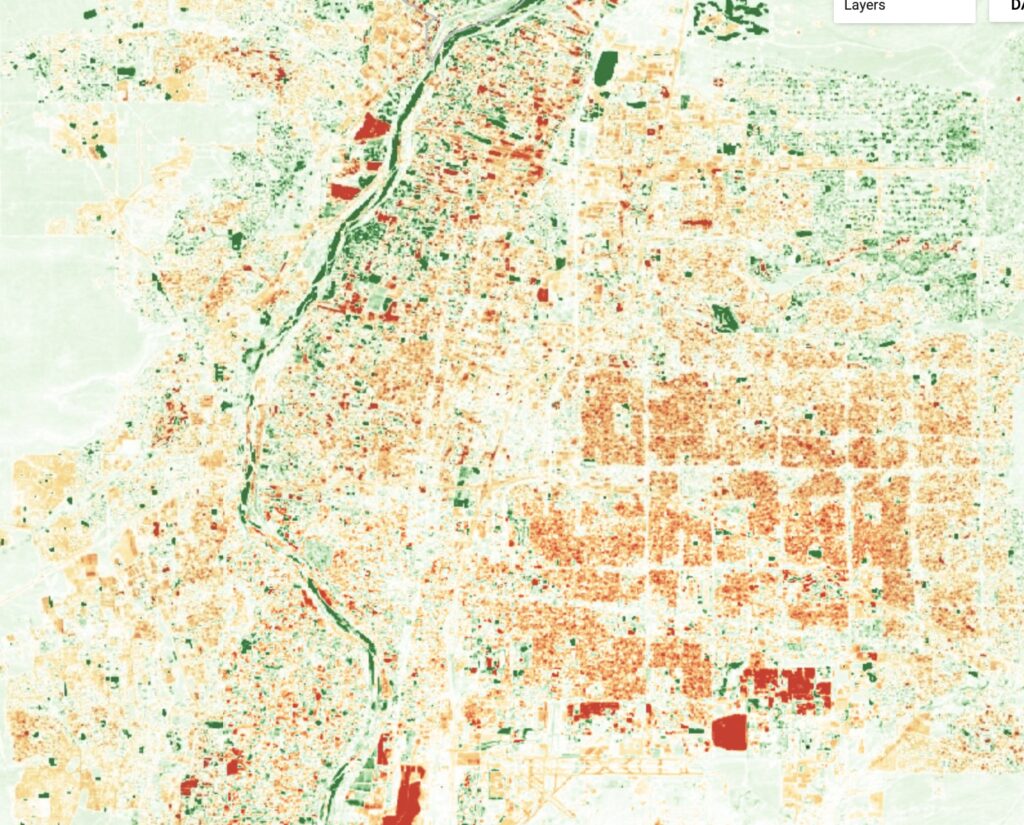
40 years of declining outdoor vegetation and, by implication, water use reductions (browns and reds) and vegetation increases (greens) in Albuquerque. Map by John Fleck/Google Earth Engine/Claude
For my morning bike ride, I headed out into one of the reddish brown areas in the map above, in Albuquerque’s Northeast Heights. These are places where greenness – trees, lawns, gardens – has declined, as measured by satellite observations that go back to the 1980s. It’s a good proxy for consumptive use of water. While our indoor water is largely recycled, returned to the Rio Grande to support downstream ecosystems and water users, outdoor green is where the real water conservation action is. These oranges and browns represent places where the consumptive use of water has been reduced. My neighborhood. We, as a community, recognized that the amount of green around us was unsustainable. We reduced it.
I could have used Albuquerque as an example 10 years ago in Water is For Fighting Over – in fact, I did a bit in the book. Las Vegas was bigger and offered more storytelling juice, though. Plus Albuquerque’s ambiguities – the green bits on the map – pose a challenge to the narrative. Large areas of the Rio Grande Valley floor, neighborhoods with municipal service but where many homes use domestic wells and irrigation ditch water for outdoor landscaping, are beyond the reach of municipal water conservation programs.
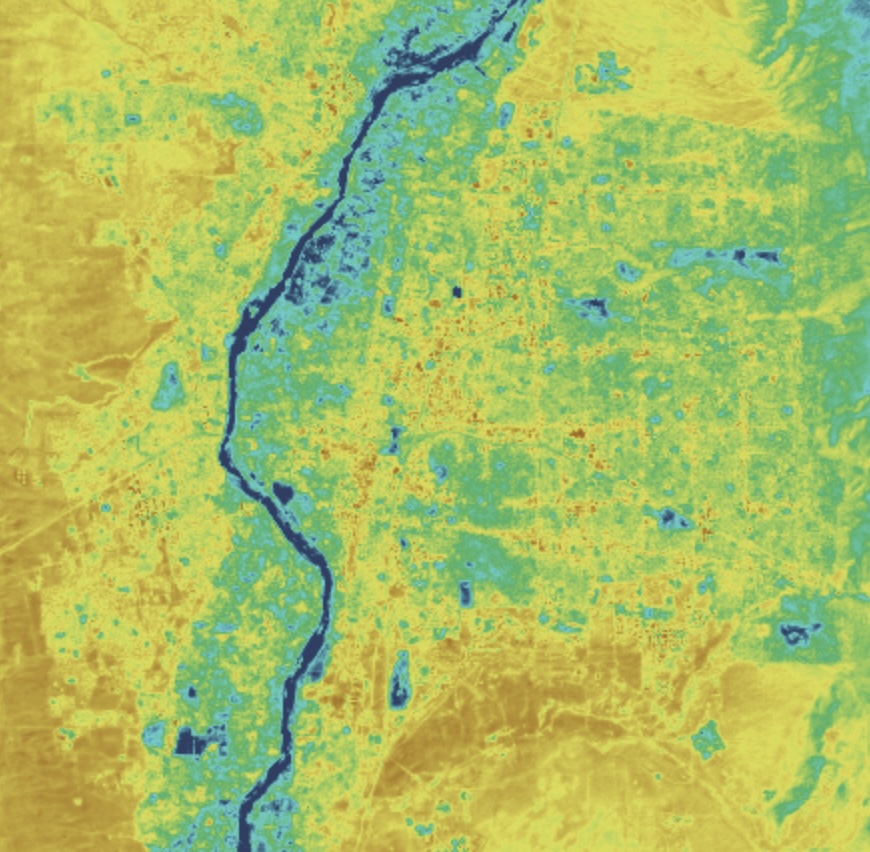
Water use in Albuquerque, 2025, via OpenET. Blue is highest, yellows and browns are lowest
Here’s 2025 for the greater Albuquerque area via OpenET. The colors represent a rate of water use, which water nerds could think of as acre-feet per acre – blue is highest, then green-yellow-brown are lower. When you combine the rate – acre-feet per acre – with lower population density (fewer people per acre, much larger lots on the valley floor, many of them served with domestic wells and ditch water) you have a clear disparity in water use. Neighborhoods that have much lower per capita consumptive use of water (less green + smaller lots) are the ones most likely to have been conserving water, reducing their use. Neighborhoods that, because of the combination of large lots, greener landscapes and access to relatively unregulated supplemental water from shallow wells and ditches, have higher per capita use and are more likely to be increasing that use. (Our first cut at the data on pages 31 and following here.)
obligations
As I’ve written previously in this space, that big blue stripe down the middle of the map, the riverside forest we call the bosque, is seeing significant dieback.
We don’t have the science yet, or at least I don’t, to understand the multiple factors that are leading to the dieback. The obvious immediate causal element is that the river that feeds the shallow aquifer that feeds the cottonwood roots has gone dry. Whether the pressure from shallow aquifer pumping from domestic wells adjacent to the river, or deeper pumping from municipal wells, played a role in hastening the water table’s drop away from the cottonwoods’ roots is a question for the groundwater hydrologists.
Folks are working hard and fast on this.
But in the long run we face hard choices as a community. There is less water. There will be less green.
Sad but true.
I never begrudged ABQ its river bosque. I was glad to see it provide some green relief for its residents.
Tucson cut its consumption dramatically and it’s a brown city. I am sorry ABQ is on the same path.
Pray for rain, and conserve in the meantime.
Wasn’t the argument in your book that “water’s for fightin’ over” was no longer the case, that civilized people would work it out? It does not seem to be the case. As well as I know, Tucson is still the lowest per capita use of water among the Colorado River recipients. We are in “Thelma and Louise,” and we are over the cliff.
Michael – I argued that “Water’s for Fighting Over” was not inevitable or the only outcome, that people *could* collaborate if they chose to, that they more often do cooperate, and offered a bunch of examples. I didn’t argue that they *would* cooperate, but I did point out that the consequences if they didn’t wouldn’t be pretty. Which is what we’re now seeing.
The Entsminger quote is really interesting. One alternative might be for users to suggest how their neighbors might conserve more water.
It seems to me (Arizonan here) that the Upper Basin states’ recommendation would be for everyone to move away from Lower Basin states.
From a Lower Basin perspective, it seems like there are realistic changes that states like Utah and Colorado could (and likely will need to) make. Get rid of ditch water in Utah. Grow fewer, higher-value crops in Colorado on laser-leveled fields or with more sophisticated drip irrigation. There are some things the Lower Basin states have been doing for decades now.
Does anyone have solutions on offer?
This morning, the ditches are flowing again, at least adjacent to Griegos Lateral. I don’t understand how there is any water to flow, but it’s a joy to be near.
John, I have a problem understanding the map in which blue is “highest use.” It appears the greatest user of water is the river itself. Seems ironic or philosophical (especially with the riverbed dry for months).
Does anyone suggest we xeriscape Los Poblanos, Rio Grande Nature Center, or Tingley so that we all share the pain. The map that shows the belt-tightening in some areas may not reflect the number of car washes. We could do with fewer of those.