A flood for the ages.
The group chat among my Colorado River posse blew up again this morning as the nerds compared reservoir and stream gage readings resulting from a storm for the ages in the Four Corners.
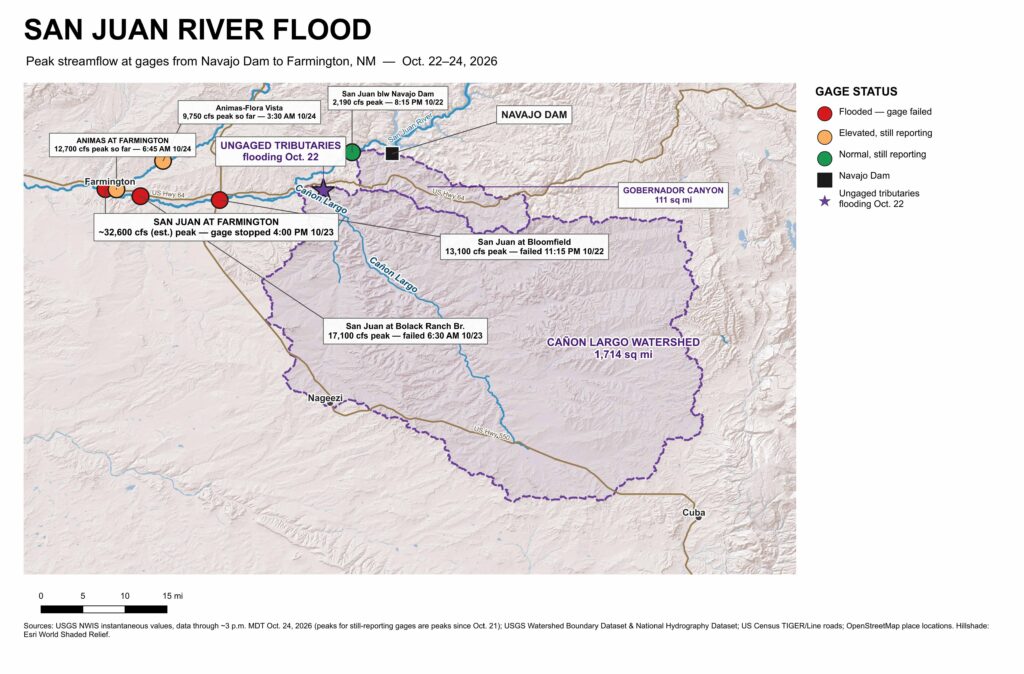
Staring at gages, you can see the wave of water coming down the San Juan. The gage at Bloomfield blew out late Thursday night, reading 13,100 cubic feet per second (cfs) before it failed. Downstream, the wave blew out the gage at the Bolack Ranch Bridge 7 hours later, running at 17,100 cfs. By the time the USGS gage on the San Juan at Farmington blew out Friday afternoon, the river had risen to ~32,600 cfs, the most water recorded there since the 1930s and more than double the biggest peak since Navajo Dam was completed in the early 1960s.
Flooding stretched from Pagosa Springs on the San Juan River in Colorado to Dennehotso on the Navajo Nation, with what appears to be the greatest impact on human communities in the Northwest New Mexico community of Farmington, at the confluence of the Animas and San Juan rivers. (The Tri-City Record seems to be the go-to source for news out of Farmington, also Patrick Lohmann at SourceNM, local and regional journalism FTW.) The report everyone keeps citing in news stories, via the National Weather Service, from late morning yesterday (Friday, Oct. 23), cites Farmington-area law enforcement saying “As many as 1500 homes and buildings are estimated to be impacted by flooding.” That’s 24 hours old.
At 11 a.m. this morning (Saturday, Oct. 24), they closed the Highway 64 bridge over the San Juan in Shiprock after the San Juan overtopped the bridge.
I’m only loosely familiar with the area, and I’m not on the ground up there, but based on the gage readings and reports from emergency managers it looks like most of the water came out of two normally dry tributaries – Gobernador Canyon (a 111-square-mile watershed) and the much larger Cañon Largo (1,714 square miles). This is mostly a process of elimination – the gage below the Bureau of Reclamation’s Navajo Dam peaked at 2,190 cfs Thursday night, which puts an upper bound on the release. Gobernador and Largo are the most plausible ungaged watersheds between the dam and Bloomfield. Also, there was a report of flooding and evacuations in Largo Wash and Gobernador Canyon Thursday evening at 5:39 p.m., less than 6 hours before the Bloomfield gage went dark. The Animas at Farmington was only adding ~8,000 cfs Friday when the gage on the San Juan hit ~32,600 cfs and stopped reporting.
One of the lessons I learned as a young journalist covering earthquakes in California is that the places identified as having the most damage from a natural disaster are not necessarily the worst-hit places. They’re often the places that are the worst hit and still have the ability to communicate. This is sparsely populated Navajo and Jicarilla Apache Country, and I’d assume that the danger and the damage we’re hearing about from the population centers does not tell the full story of the suffering underway in the region.
Climate and flooding
We have three different primary kinds of flooding in the interior arid Southwestern United States: from spring and summer snowmelt; localized flooding from the summer monsoons; and autumn tropical storm remnants. We’re now experiencing a wave of classic tropical storm remnants.
The moisture that hit the Four Corners came from the remnants of Hurricane Trudy, which skirted the west coast of Mexico Oct. 16-19. This is not a visit from the hurricane itself, but rather its remnant moisture being pulled into the storm track, providing massive moisture fuel for what follows.
A group led by Elizabeth Ritchie at the University of Arizona some years back quantified the impact these storms can have:[1]
Although the tropical cyclone–strength winds rapidly diminish upon making landfall, these systems still carry a large quantity of tropical moisture and, upon interaction with mountainous topography, are found to drop up to 30% of the local annual precipitation.
Much like the summer monsoon, the impact of climate change on this kind of storm in the future is challenging to understand because these storms happen at spatial scales that are difficult for General Circulation Models, the big climate models used to understand the effects of rising greenhouse gases, to resolve. The coarse resolution of the GCMs tends to underestimate how much precipitation comes from the biggest storms – this is an issue I wrote about back in my science journalism days in the ’00s. We have new higher resolution GCMs now, but they still seem to struggle with this.[2]
Ritchie, Elizabeth A., Kimberly M. Wood, David S. Gutzler, and Sarah R. White. “The influence of eastern Pacific tropical cyclone remnants on the southwestern United States.” Monthly Weather Review 139, no. 1 (2011): 192-210. ??
Bjarke, Nels R., Ben Livneh, Joseph J. Barsugli, Angeline G. Pendergrass, and Eric E. Small. “Evaluating Large-Storm Dominance in High-Resolution GCMs and Observations Across the Western Contiguous United States.” Earth’s Future 12, no. 6 (2024): e2023EF004289. https://doi.org/10.1029/2023EF004289. ??
We were house hunting in Asheville, NC when Tropical Storm Helene roared through, also dropping a thousand year rain event on the area. Kinda put a damper on that house hunting idea for a while.
https://en.wikipedia.org/wiki/Effects_of_Hurricane_Helene_in_North_Carolina