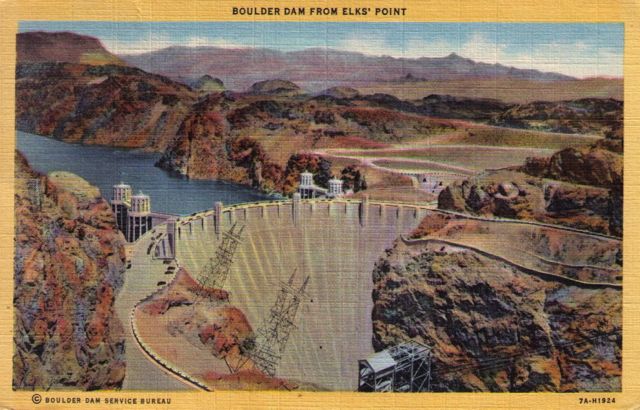
Boulder Dam, circa 1946: “a lot of propoganda for Daddy to read”

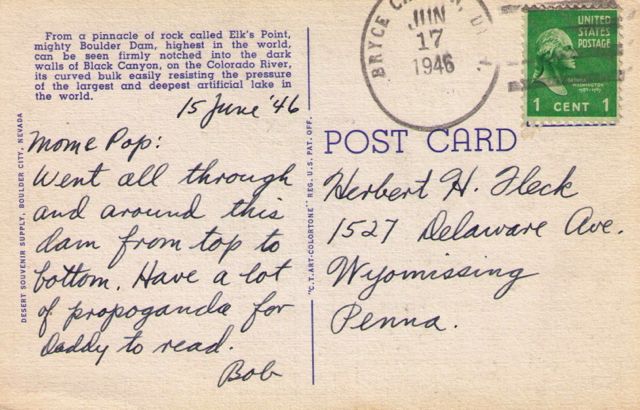
My sister, Lisa, found a box of Dad’s old postcards over the weekend, including a number he had sent during a trip out west in 1946. He’d just gotten out of the Army, a Pennsylvania kid wandering the landscape that would later animate his art and become our home. There was this, to his parents back in Wyomissing, from his tour of Boulder Dam:

Boulder Dam from Elks' Point

Boulder Dam from Elks’ Point

"a lot of propoganda for Daddy to read"

“a lot of propoganda for Daddy to read”


15 June ’46

Mom & Pop:

Went all through and around this dam from top to bottom. Have a lot of propoganda (sic) for Daddy to read.

Bob

measuring drought – the right tool for the job

Richard Seager’s widely cited 2007 paper projecting “an Imminent Transition to a More Arid Climate in Southwestern North America”  did not use the Palmer Drought Severity Index. His work relies on a calculation of precipitation minus evaporation (P – E) to determine the extent and trend of drying under a changing climate. In response to my recent inquiries about the flurry of news involving the question of whether the Palmer shows any global drought trend (background here, here, here) Seager emailed this (shared with permission, linkage added by me, with the plot to which he refers below, click to biggen):

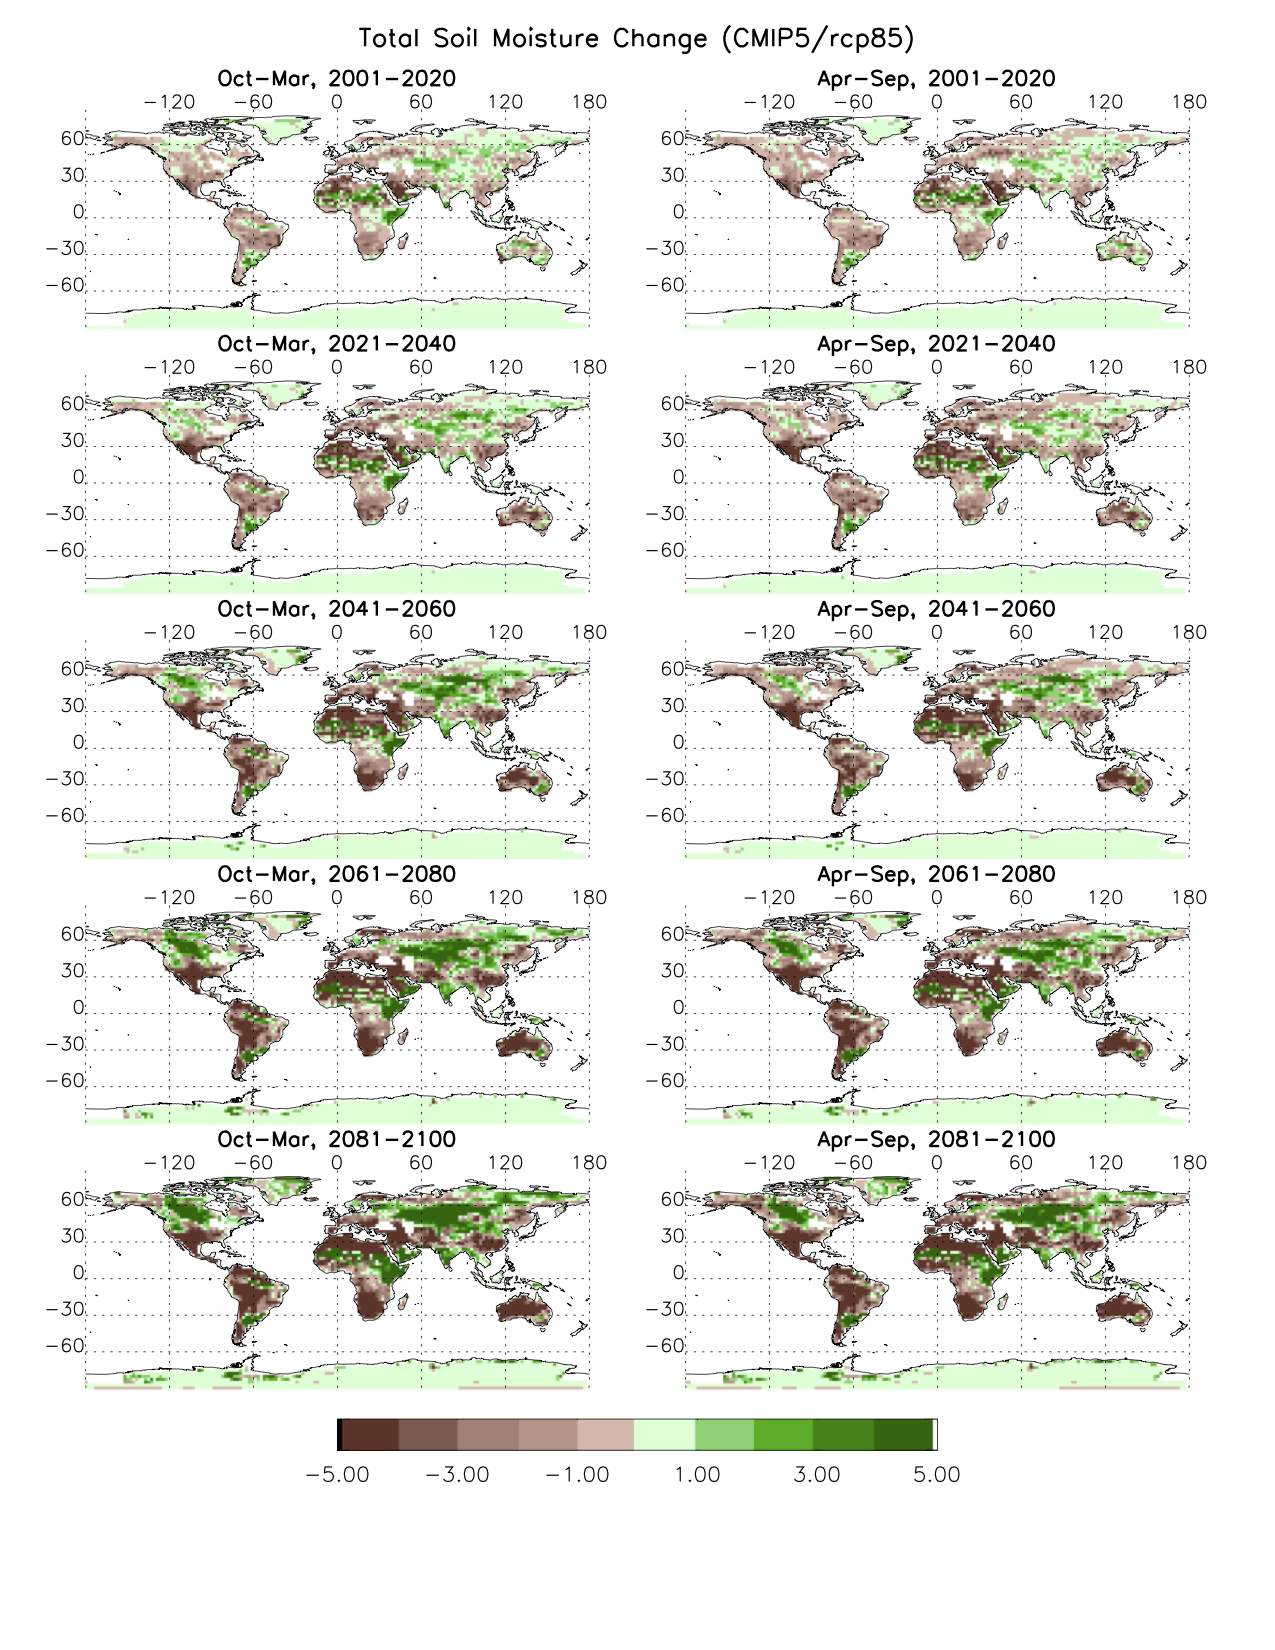
PDSI should not be used for future climate change, pure and simple. The Sheffield paper redoes in many ways a 2008 paper by Eleanor Burke (UK Met. Office) that made the same point about the pitfalls of the simple PET calculations in the PDSI calculation. Indeed Chris Milly has recently made the same point. The problem with the Sheffield paper is it then leaves the impression that there is little to worry about. Not so. Here is an unpublished plot of change in soil moisture for summer and winter half years for the CMIP5 ensemble with the rcp85 scenario – I made % change maps for each model and then averaged the %s to make the multimodel ensemble mean. Bottom line – you still see the widespread drying that PDSI trends indicate though a 10% drop in soil moisture is probably less dramatic in appearance than -10 PDSI.

Global Drought Trends

Global Drought Trends, courtesy Richard Seager


stuff I wrote elsewhere: “Depends on what you mean by ‘drought.'”

From the morning paper, an exploration of what we mean by “drought”, with some stuff on the Sheffield Nature paper so talked recently in drought circles, along with the latest grim outlook:

“Drought,” University of Arizona research Gregg Garfin said, “is defined by its impacts.”

I realize this is a long-winded way of being very unhelpful to Ken, whose question started all my inquiries. My simpler answer, Ken is, “Depends on what you mean by ‘drought.’ ”


Stuff I wrote elsewhere: on drought metrics

From the work blog, some material from a discussion among drought researchers on the Sheffield Nature paper and the question of when the Palmer Drought Severity Index is or isn’t the right tool for the drought measurement job. Here’s Dave Gutzler:

Despite its many limitations PDSI is still a meaningful indicator of short term climate variability (interannual, maybe up to decadal, time scales). If you look at the uncertainties described by Sheffield et al., they are on scales of tenths of PDSI units on continental-global scales. Big short term droughts, which are primarily driven by precip anomalies, will be captured by PDSI regardless of the method used to describe evapotranspiration. For that matter, the magnitude of long-term change looking forward, associated with really big century scale temperature change, will show up as ‘long term drought’ regardless of the details of the PDSI calculation. That’s why so many different hydrologic indicators (streamflow, vapor pressure deficit, etc.) that do not incorporate similar debatable ET parameterizations all point in the same direction. And that’s why I don’t think the Sheffield paper should require us to reject the validity of the core conclusions presented in so many recent papers.


Stuff I wrote elsewhere: court rules against New Mexico water transfer

From Saturday’s newspaper, my story about a state court ruling against a proposed groundwater transfer case in New Mexico:

State officials made clear Friday that, while they ruled against this application because of its failure to specify where and how the water would be used, they do not in general oppose water transfers around the state.

Such transfers are frequently mentioned as a way to meet growing needs in the Rio Grande Valley. D.L. Sanders, lead attorney for the Office of State Engineer, encouraged the Augustin Plains Ranch group to file a new application that meets the state’s legal requirements.

“We’re in favor of promoting innovative ideas like this,” Sanders said.


So what exactly do we mean by “drought”?

The Sheffield et al drought paper in Nature that I blogged quickly about a couple of days ago has triggered all kinds of fascinating discussion among folks in the southwestern US “drought community” (yes, there is such a thing). In brief, Sheffield and colleagues argue that a careful application of the Palmer Drought Severity Index suggests that there has not, in fact, been a discernable global increase in drought over the last 60 years.

There’s been some pushback from other researchers who have been using PDSI and coming to a somewhat different conclusion (see Aigua Dai here, for example). This suggests to me that, at the very least, PDSI’s sensitivity to the inputs that lead Dai and Sheffield to such different conclusions should give those of use who have been using it as something of a black box (I’m looking at me) some pause.

But more importantly for my purposes as a communicator, the discussion about the paper has served to reinforce the problem with the word “drought”, which is often used loosely (I’m looking at me) without care to delineate what sort of drought, with what sort of effects, we’re talking about. This recalls a 1985 review by Wilhite and Glantz that found 150 definitions. Here there be communication dragons.

Insofar as “drought” means variance on the dry side from the norm, but the norm in at least one key variable (temperature) is changing, what are we to with the statistics, and also with the word?

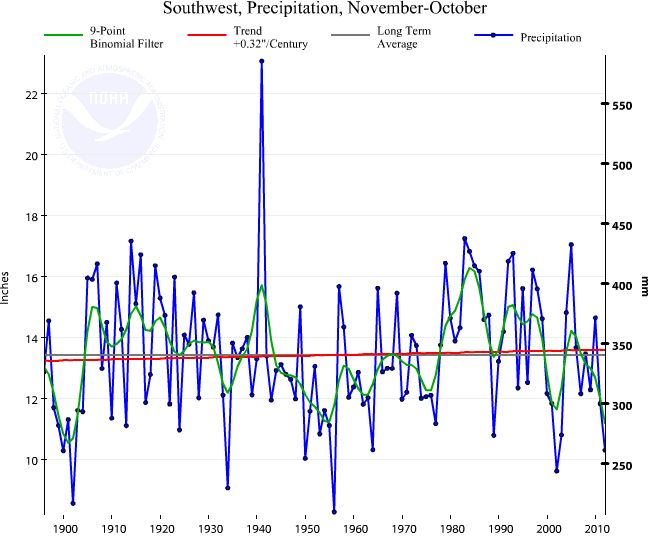
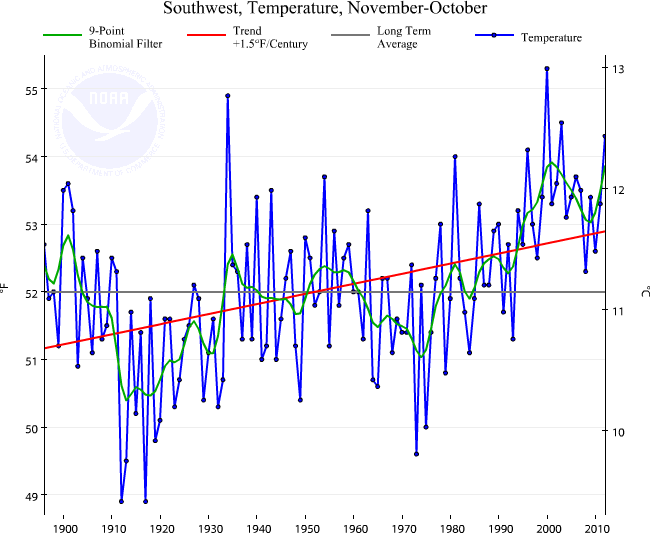
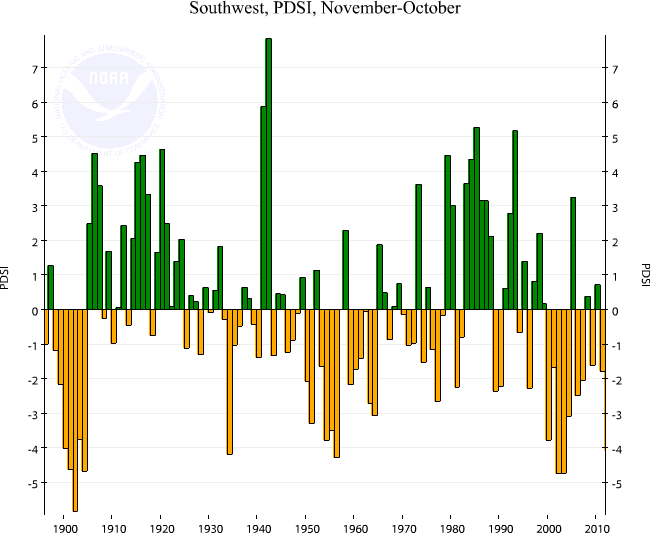
As a conversation starter, here’s some basic data on “drought” for the southwestern United States (Utah, Colorado, Arizona and New Mexico).

Precipitation

Precipitation

Temperature

Temperature

Palmer Drought Severity Index

Numbers represent 12-month averages, ending October (the most recent data). Data courtesy NCDC.

Some good news today on climate change: less drought than we thought

A new paper in today’s Nature by Justin Sheffield and colleagues suggests we’ve been using simplistic calculations that have overestimated the increase in drought globally over the last 60 years in response to greenhouse warming. Scientists typically use the Palmer Drought Severity Index, a bit a statistical black box that bases its drought estimate on a formula that combines precip and temperature data with normals for the geographical spot in question. Using PDSI, people have calculated increasing global drought as a result of global warming.

Sheffield and colleagues argue PDSI is too simplistic to capture what’s really going on:

More realistic calculations, based on the underlying physical principles8 that take into account changes in available energy, humidity and wind speed, suggest that there has been little change in drought over the past 60 years.

From an accompanying Nature “news and views” piece by Sonia Seneviratne:

The findings imply that there is no necessary correlation between temperature changes and long-term drought variations, which should warn us against using any simplifications regarding their relationship.


How the US-Mexico Colorado shortage/surplus sharing deal works

When the federal government and the seven US states that share the Colorado River signed their 2007 “Interim Guidelines for Lower Basin Shortages and the Coordinated Operations for Lake Powell and Lake Mead,” the final Record of Decision (pdf) included several chunks of legalese to the effect that the deal, while binding on the US side of the border, should not be interpreted as having any effect on sharing (or not sharing) of water across the US-Mexico border:

The United States will conduct all necessary and appropriate discussions regarding the proposed federal action and implementation of the 1944 Treaty with Mexico through the International Boundary and Water Commission (IBWC) in consultation with the Department of State.

That consultation’s been underway ever since, and we’re about to see the fruits of the discussion in the form of Minute 319, an addendum to the 1944 Treaty Between the United States of America and Mexico: Utilization of Waters of the Colorado and Tijuana Rivers and of the Rio Grande (pdf).

Under the current, pre-Minute 319 state of affairs, Mexico is entitled to 1.5 million acre feet of Colorado River water each year, along with some fuzzy treaty language that in “extraordinary drought” (whatever that means – it’s not defined), Mexico will have its water reduced the same as everybody else.

There’s a lot in Minute 319, much of it which I don’t yet understand (we haven’t seen the actual language, just incidental documentation). I’ll stick here to the details of the shortage and surplus sharing. Here’s how it works.

Under the 2007 Interim Guidelines, the level of Lake Mead is used as a trigger for reducing water allocations to the Lower Basin states. When Mead’s surface hits 1075 feet above sea level, the total Lower Basin allocation is cut from 7.5 million acre feet to 7.167 maf, with the shortage shared between Arizona and Nevada. When it drops below 1050, there’s a deeper cut, to 7.083 maf (also Arizona and Nevada take the hit – California’s senior rights on the river trump here).

Under Minute 319, Mexico now joins in the droughty fun, seeing its 1.5 maf cut by 50,000 acre feet when Mead’s below 1075. Below 1050, Mexico takes a 70,000 acre foot hit.

On the flip side, Mexico now also has the opportunity to share in surpluses. When Mead is above 1145 feet above sea level, Mexico gets an extra 40,000 acre feet of water. Above 1170, an extra 55,000 acre feet. Above 1200, an extra 80,000 acre feet.

There’s much more to the deal, including an expansion of Mexico’s ability to store water in US reservoirs, and environmental flows in the Colorado River Delta. I’ll try to avoid writing about that stuff until I actually understand it. In the meantime, here are some links to more information:
 

nota bene: population growth in the West’s urban archipelago*

Just the blog equivalent of thinking out loud here. It’s not that this data was surprising to me, so much as that I wasn’t sure what to expect.

Four cities in the western United States with some similar characteristics – arid climate, water supply challenges, growing populations. Each of the four is the dominant population center in an otherwise sparsely populated state. No claim here that other cities don’t have similar characteristics (in fact, I’d love feedback on other cities/states worth adding to the conversation).

First: total population in the Census-defined “Metropolitan Statistical Areas” since 1970:

Population

Population

Now, indexed with 1970=100, to get a feel for rate of growth independent of starting size:

population, indexed

population, indexed

It’s really this second one that interests me more – the relative growth curves are easier to see. Albuquerque and Salt Lake City growing slowly, Phoenix faster and Vegas’ growth curve bending up dramatically beginning in the late 1980s. This has all kinds of importance for water policy and regional economics. Though I’m not sure what to make of it all, just wanted to get it down somewhere for future reference.

If I’ve done this right, the spreadsheet’s posted here if anyone wants to have a look. Data source is US Census Bureau via the St. Louis Fed’s marvelous Excel plug-in and some math by me to aggregate MSAs from individual county data (danger!).

* I stole the “archipelago” concept from a talk by Mark Hagerty of Headwaters Economics, though his archipelago looks quite different from mine. But what we both mean, I think, is “economic islands in the sea that is the rural West”.