In response to the latest abuse of the Twain whiskey/water non-quote*, this:
Water's for makin' beer?
In response to the latest abuse of the Twain whiskey/water non-quote*, this:
Water's for makin' beer?
A couple of notes from Las Vegas, NV, the front line of the housing collapse, that have significant implications for the region’s long term water future:
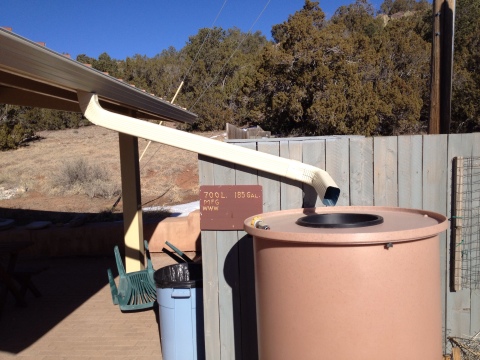
It’s all fun and games until you actually have to measure snow.
The US Bureau of Reclamation’s first 2012 Colorado Basin reservoir forecast (the “24-month study”, pdf) projects a decline in total storage in lakes Mead and Powell, the Colorado River’s largest storage reservoirs, of 844,000 acre feet, or 2.76 percent.
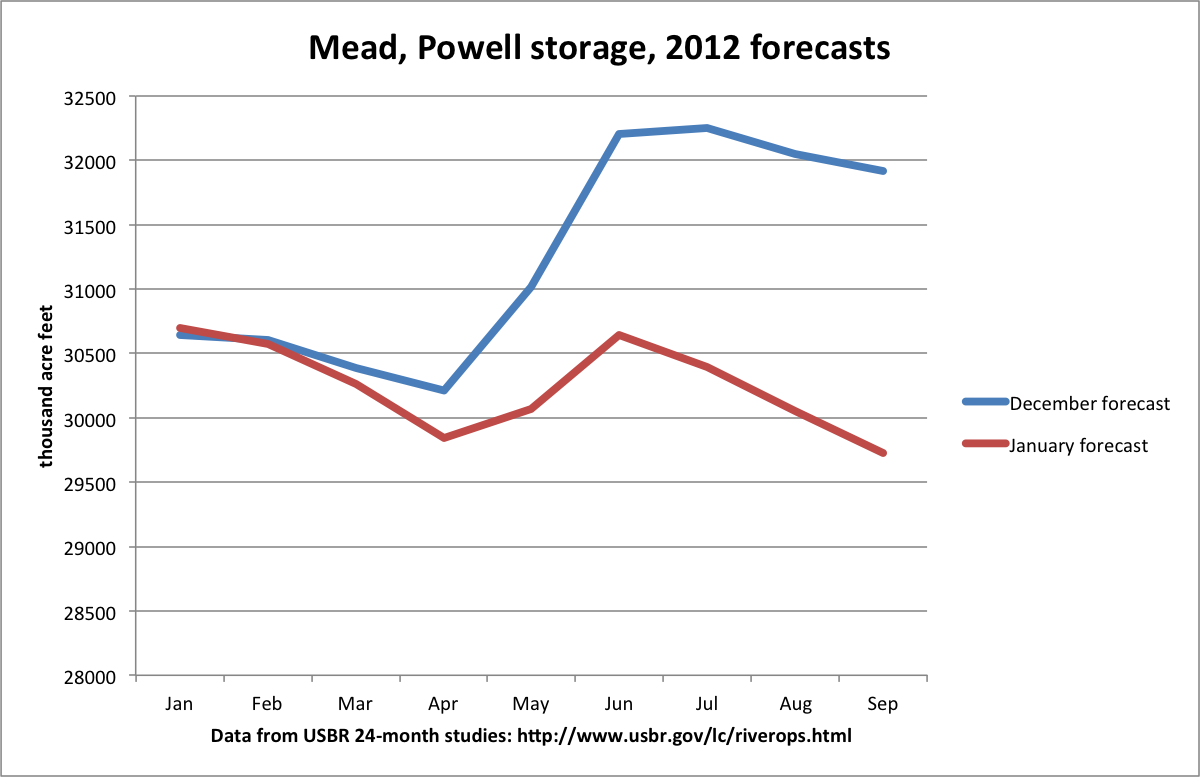
Dec. and Jan. 2012 Colorado storage forecast
There are two ways of framing this.
Let me start with the pessimistic, illustrated by this graph comparing the December and January projections. The December projection is based on no real forecast at all, but rather what amounts to an assumption of normal snow. There’s nothing wrong with this. That early in the season, the water managers have no idea what to expect, and they’re not making decisions based on the forecasters, so you could think of it as a placeholder. The January forecast is based on the first real numbers, which show a paltry snowpack in the upper basin – 66 percent (by one measure, the Colorado Basin Forecast Center’s aggregation of snow measurement sites upstream of Lake Powell) as of the date the forecast was made. The blue line is the December forecast, the red line is January once actual snowpack for the years is factored in. It’s down 2.2 million acre feet. But since that time, there hasn’t been much snow. The CBRFC Powell group today (Sat. 1/14/12) is down to 58 percent of average. Don’t put too much stock on the specific percentages (Danger! Amateur using Snotel!), but rather look at the trend. It’s down. With the forecast favoring dry through the end of the month, it’s reasonable to expect the projections to drop.
That’s the pessimistic frame.
Here’s the optimistic frame.
While an 844,000 acre foot drop is a lot of water, last year the total storage in the two reservoirs rose by 5.2 million acre feet. It would take six consecutive years of drops of the size currently projected for 2012 to wipe out the gains from last year’s bounty. From 2000-2010, during the Drought of the ’00s, the reservoirs averaged a 2 million acre foot per year drop. 844kaf is not a big number in that context.
Here’s my total storage graph, updated with the end-of-water year 2012 estimate from the latest 24-month study:
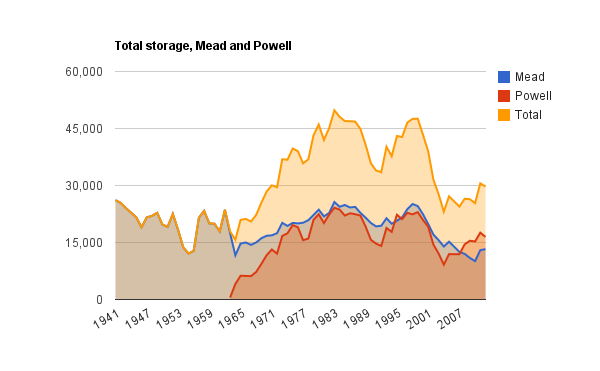
Total historic storage in Lakes Mead and Powell (2012 projected)
What do you think? Which frame is “right”?
While archaeological metaphor can be instructive, I think we make more progress in understanding the fate of the Southwest under conditions of aridity and water scarcity by looking at what’s happening now, in the places that are really running short of water. What are people actually doing today?
Which is why the Imperial Valley of southern California is on my radar, as it negotiates the minefield of ag-urban transfers:
The Imperial Irrigation District is looking for water, and a new subcommittee is being created to find a solution.
The district is now accepting its second round of solicitation applications for its 2012-2013 fallowing program. The district has reopened the application process, mailed notices out and is hoping to get a good response to make up water for the July 1, 2011, through June 30, 2012, fallowing cycle, said Tina Shields, assistant water department manager. The payment rate has also been increased from $85 per acre-foot to $100 per acre-foot.
One of the most promising strategies for water conservation in the arid west involves fallowing of agricultural lands. Done badly, it has earned the pejorative nickname “buy and dry”, as cities buy up ag water rights, take the land out of production and shift the water to urban toilets and taps. But done right – the fallowing agreement between the Metropolitan Water District and the Palo Verde Irrigation District is an oft-cited example – it can compensate farmers and keep ag economies robust and healthy.
Brett Walton at Circle of Blue explores an intriguing example in the San Luis Valley in southern Colorado – fallowing some crop land in the valley to save water for other farms. So instead of farm-to-city, this is fallowing one farm to save another. But he also highlights a problem in this year of extraordinary commodity prices:
Though it is still being negotiated, the plan has a significant obstacle: the explosive rise in food prices, which are making the sums offered by the water-conservation program less enticing. Prices for the valley’s mainstay — potatoes — have increased 25 percent in the last five years. Wheat, alfalfa, and barley prices have done even better, more or less doubling over the same period.
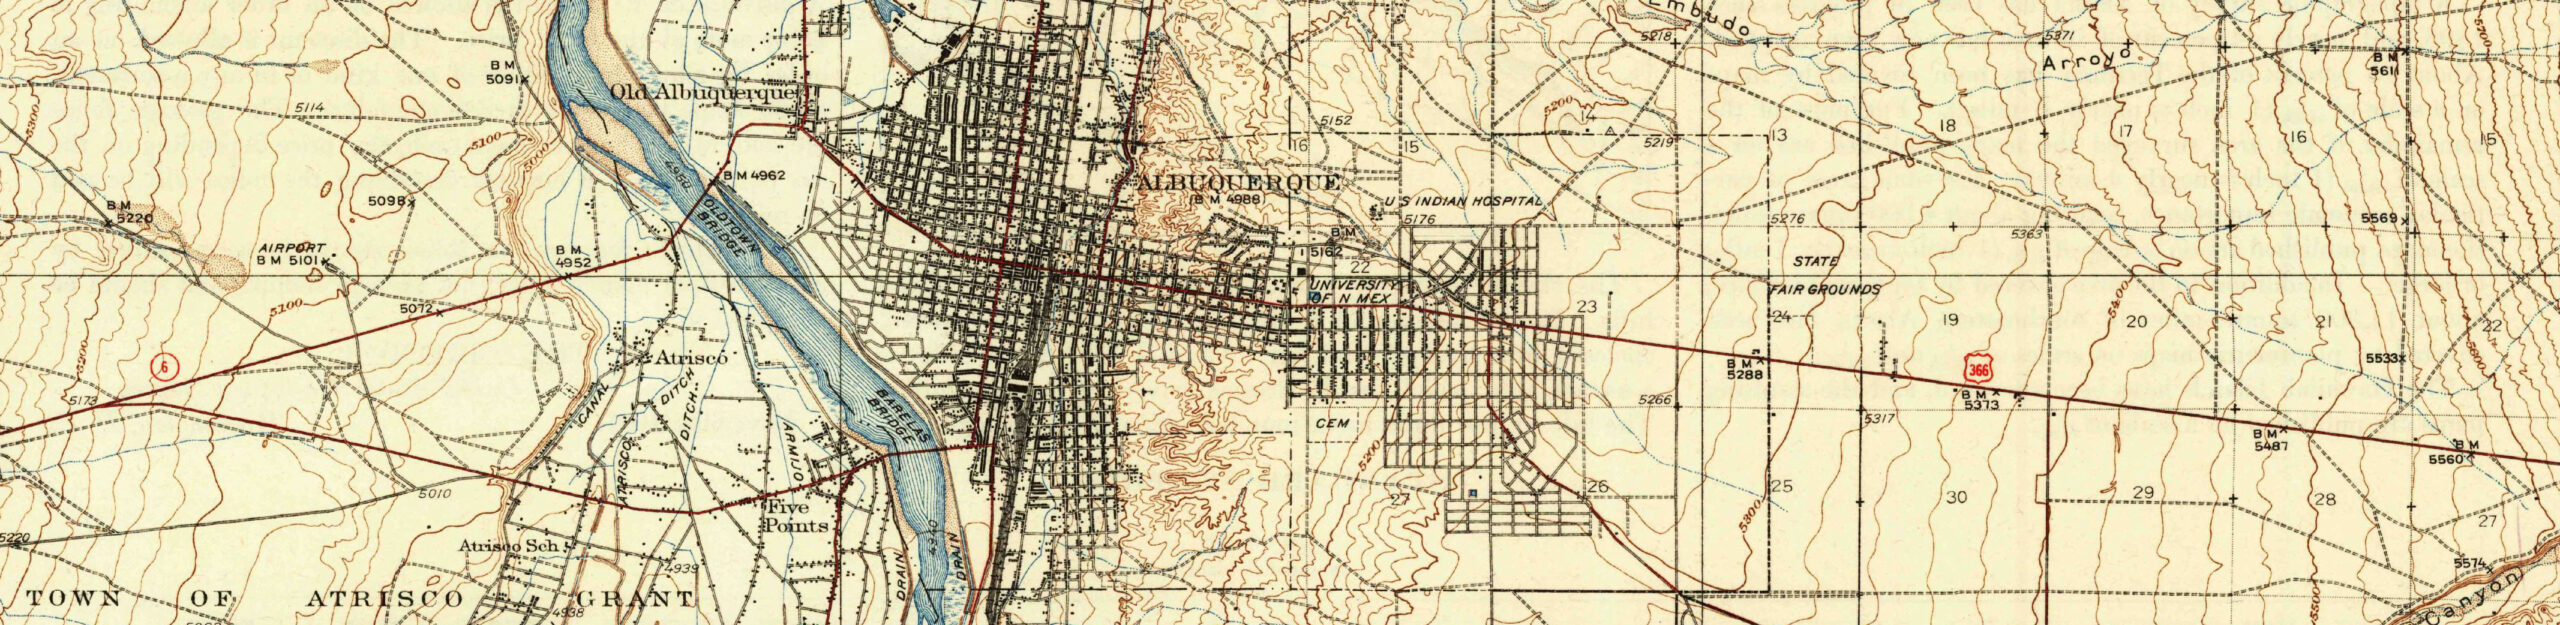
It’s not a big drop, but in the face of drought and modest population growth, Albuquerque’s water use dropped in 2011. From the morning paper:
The drop was tiny — less than 1 percent.
But with Albuquerque weathering one of its driest years in history in 2011, the consumption drop is significant, said Katherine Yuhas, head of the conservation program at the Water Utility.
“What we’re telling our customers is, ‘Wow, amazing job,’” Yuhas said Wednesday.
The Lamont-Doherty group that has done so much to help our understanding of the factors that drive multi-decadal droughts has added a nice piece to our understanding of the issues.
In a paper in review (for which they’ve done a nice accessible writeup), Ben Cook and colleagues looked at a number of drivers for long-duration drought: sea surface temperature, warming caused when grasses die off and leave bare soil, and then the added role of increased aerosols from dust kicked up in the ensuing mess.
The addition of active dust sources led to dust emissions and significant aerosol loading that further decreased precipitation relative to the case with SST and bare soil forcing alone. Active dust emission from the dunes also increased the persistence of the megadroughts making them more in agreement with tree ring evidence of the character of the megadroughts. In the model dust aerosols suspended in the atmosphere reflect solar radiation reducing energy available at the surface increasing atmospheric stability and reducing upward motion and convection. This suppresses precipitation.
In communities that fully reuse their wastewater (Albuquerque and Las Vegas do this now, for example, by returning sewage treatment effluent to the water’s source), it’s outdoor water use that dominates the water supply equation. And here in the arid southwest, sooner or later everyone will fully reuse their wastewater. This is not an argument against indoor conservation – it still has enormous value, in reducing the amount of water that must be pumped, treated and then returned. But outdoor conservation is where the big water supply action’s at.
Which is why this quote in Teresa Rochester’s Ventura County Star story about rising water rates and drying yards in Thousand Oaks, Calif., is so hilarious:
“It’s not like we’re fat, selfish cats sucking up water, man. It’s the landscaping,” he said. “The city fathers are proud to show people this neighborhood.”
Public understanding is hard. Comes slowly.
I’m a fan of NOAA’s Colorado Basin River Forecast Center. Here’s an example of why.
In working on my book, I’ve been spending a lot of time tracking the hydrology of the Colorado River Basin – how much precipitation falls, and where, and when. The CBRFC has great data and great tools to help. Last week I was puzzling over the Green River. One of the most useful CBRFC tools for watching a snow season play out is their “snow groups“, which collect all the real time snow measurement gauges in a watershed into a single graph. I wrote the Center asking which snow group was best for monitoring the Green River as a whole. Turns out that, as of last week, they didn’t have none that really captured the Green as a whole.
But since I asked, they made a new one.
The bad news is that, as of today, the Green watershed is at 60 percent of average:
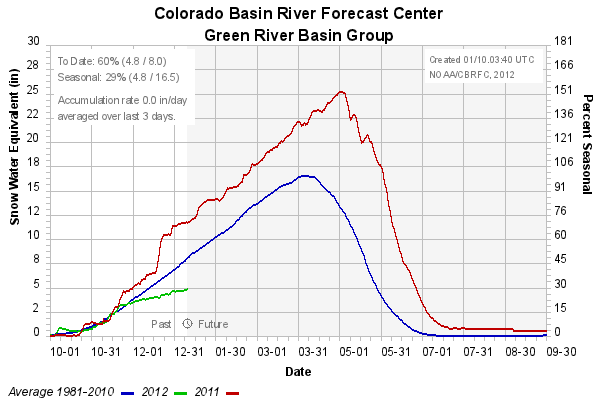
Green River watershed, Jan. 9, 2012